Images
Overview
The first step to using images is to create the "image" container.
images: [ ]
At the minimum, you will need to add the "src" attribute along with the path to the image location. By default the image will be placed in the top-left corner of your chart. Acceptable file formats include: PNG, GIF, JPEG and TIFF.
images: [
  {
    src: "/images/zinglogo_small.png"
  }
]
There are a number of styling properties that you can add to your chart images to enhance how they look and feel, including background colors, shadows, borders, and more. For a list of available attributes, please visit our JSON Syntax page.
The x and y attributes allow you to place your image anywhere on the chart. Any entered values will move the image relative to the top-left corner of the chart. Acceptable values are in pixels or as percentages.
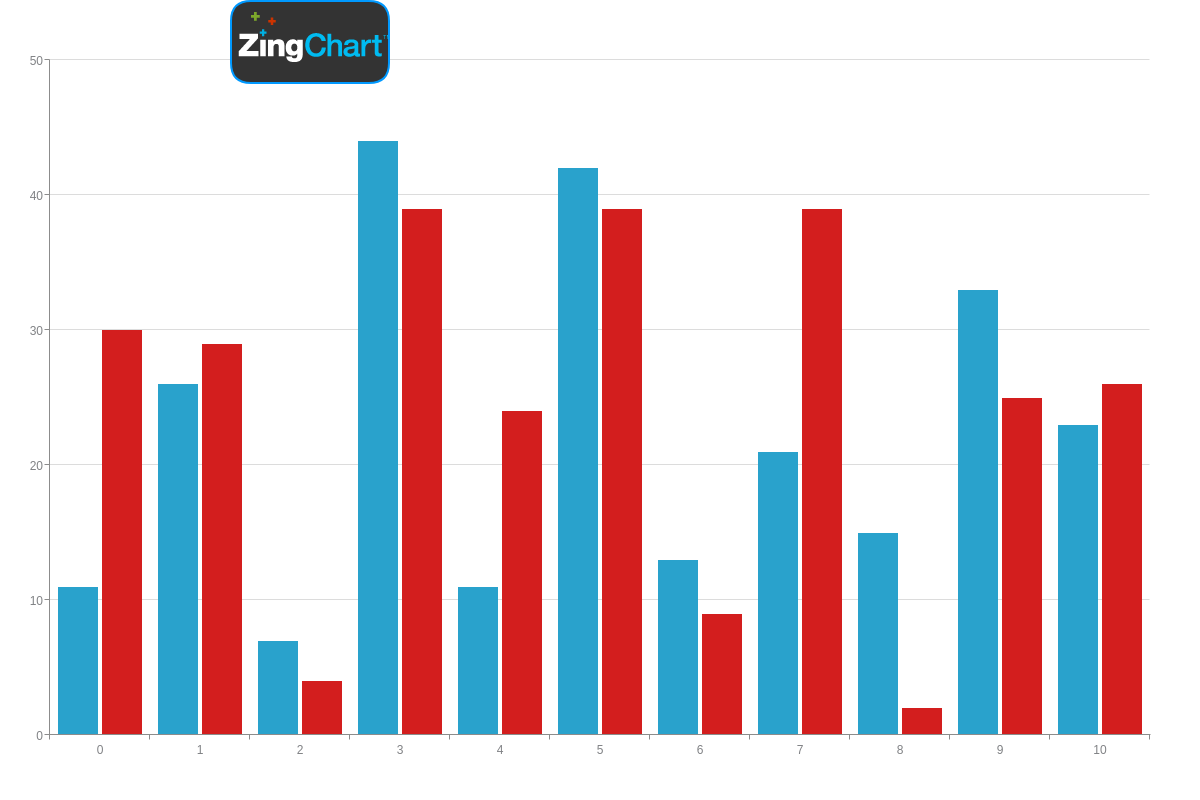
images: [
  {
    src: "/images/zinglogo_white_tm.png",
    x: "230px",
    y: "0"
  }
],
Any of the various background properties can be used to add a background color, gradients, and even a background image.
images: [
  {
    src: "/images/zinglogo_white_tm.png",
    x: "230px",
    y: "10px",
    'background-color': "#333"
  }
],

The "border-width", "border-color", and "border-radius" attributes allow you to further enhance the look of your image.
images: [
  {
    src: "/images/zinglogo_white_tm.png",
    x: "230px",
    y: "0",
    'background-color': "#333",
    'border-width': "2px",
    'border-color': "#09f",
    'border-radius': "20px"
  }
],
The "shadow" attribute allows you to add various shadow properties to your images.
images: [
  {
    src: "/images/zinglogo_white_tm.png",
    x: "230px",
    y: "0",
    'background-color': "#333",
    'border-width': "2px",
    'border-color': "#09f",
    'border-radius': "20px",
    shadow: "true",
    'shadow-color': "#999",
    'shadow-distance': "4px"
  }
],
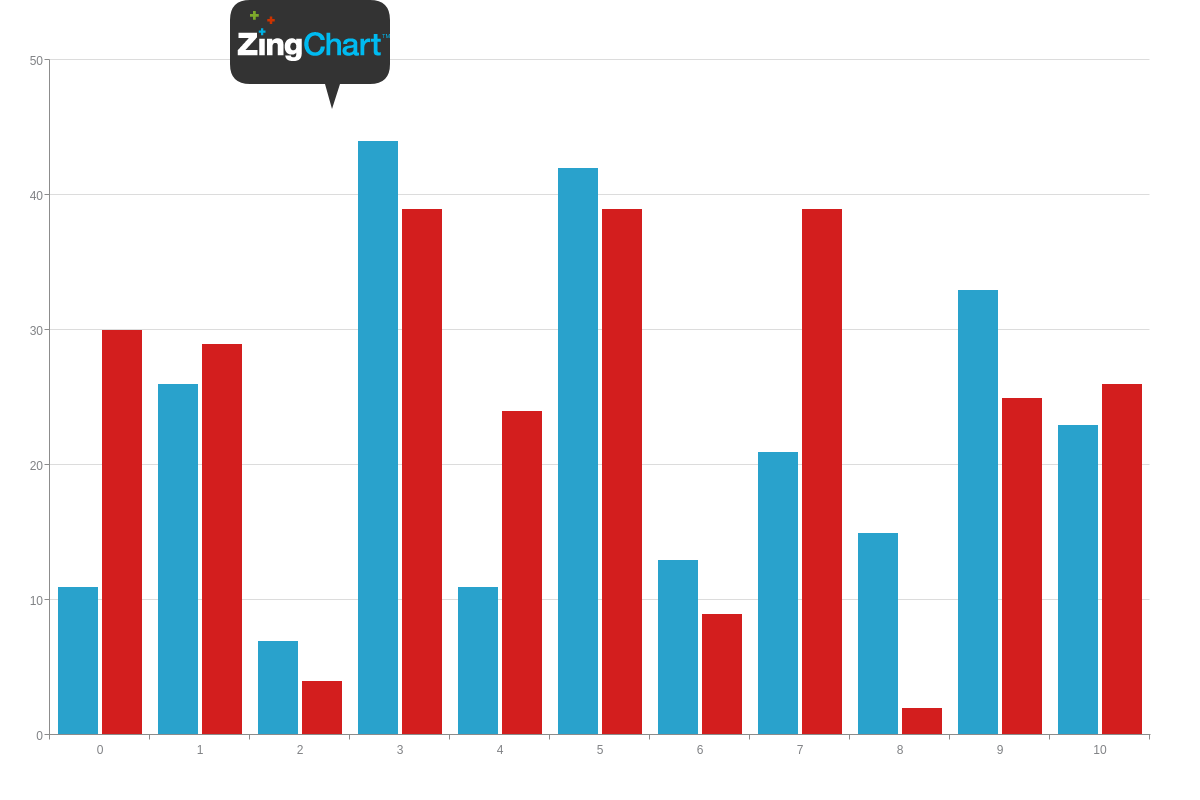
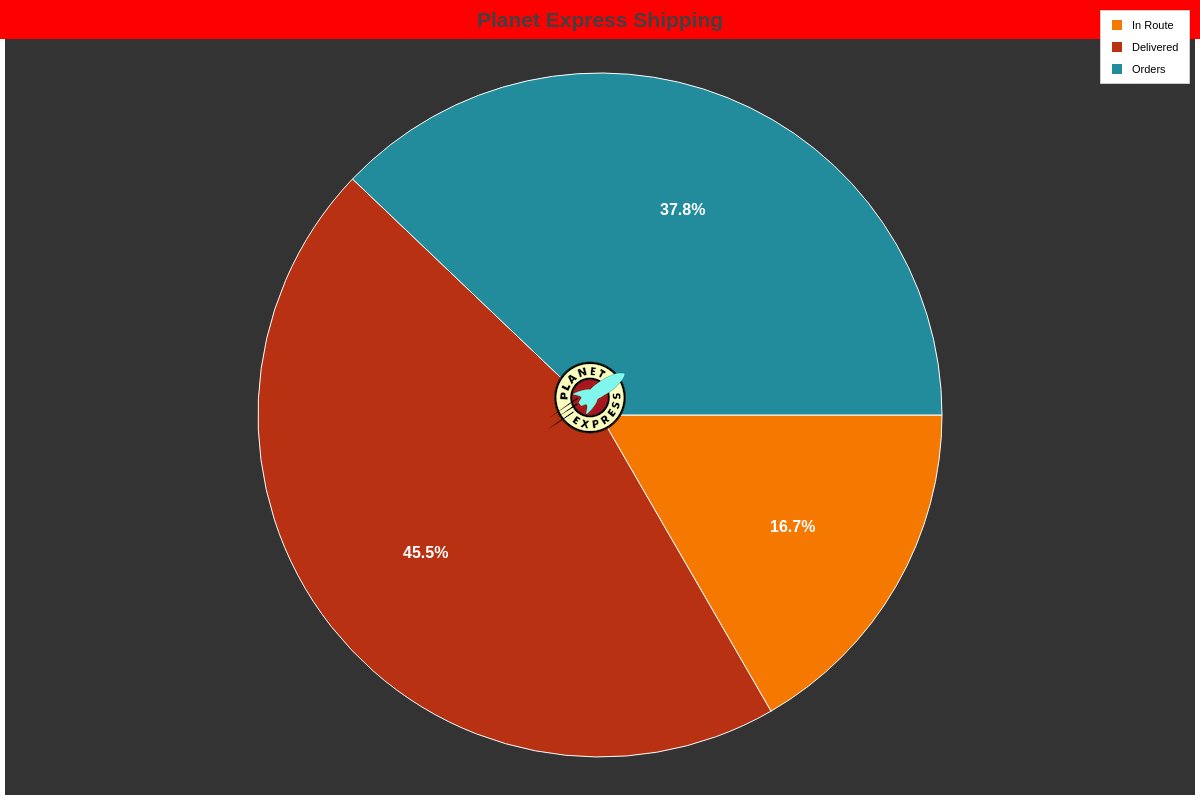
The "callout" attribute allows you to add callouts.
images: [
  {
    src: "/images/zinglogo_white_tm.png",
    x: "230px",
    y: "0",
    'background-color': "#333",
    'border-radius': "20px",
    callout: true,
    'callout-height': "25px",
    'callout-width': "15px",
    'callout-offset': "15px"
  }
],
As stated before, the "images" container can hold any number of objects. Therefore, adding another image to our chart is simple. All we need to do is add another object and give it an "src" attribute.
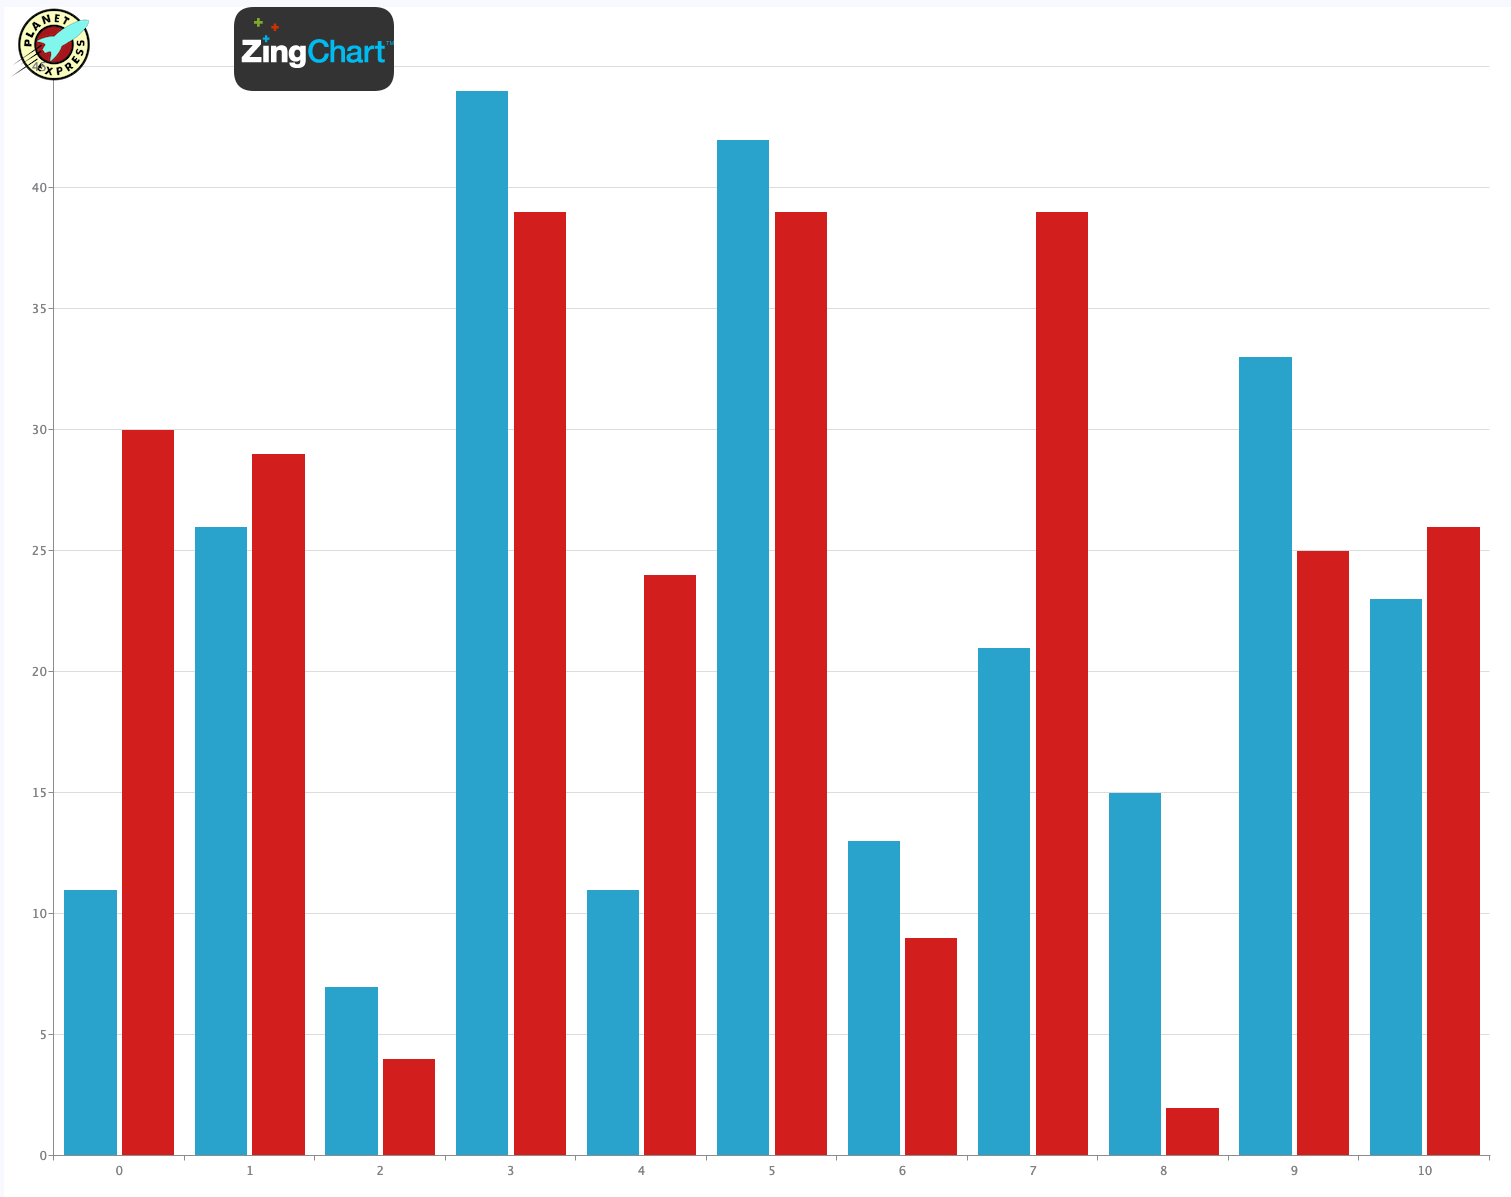
If you don't give at least one of the images an x or y position, they will both be positioned to the top-left by default and be stacked on top of each other.
images: [
  { src: "/images/Planet_Express.png" },
  {
    src: "/images/zinglogo_white_tm.png",
    x: "230px",
    y: "0",
    'background-color': "#333",
    'border-radius': "20px",
  }
],
Images are a great feature of ZingChart, and they can be styled and placed anywhere on your charts.
Don't forget, a comprehensive list of available attributes and objects can be found on our JSON Syntax page.
Images in Chart Overview
ZingChart allows a chart to hold any number of image objects which can be styled and placed anywhere on your charts.