Adding Additional Charts
You can add additional charts to your page in one of two ways:
- Create charts individually. Each chart requires a new div element, chart variable (to contain your chart data), and render method.
- Create a
graphsetarray. The array can contain multiple chart objects, enabling shared chart features easily to manage and present them as a dashboard or trellis chart.
Which method you choose depends on what you're trying to accomplish. Creating charts individually gives you direct control. Since they're unrelated, you can place each chart wherever you like in the document <body>. For charts that require shared interactions, you would use a graphset to gain access to these shared chart features easily. Dashboard charts are best for charts that relate or speak to each other in some way. They're contained in a single div element, which means they're controlled as a group.
Individual Charts Method
This method has three parts. For each new chart, you need to:
- . add a
divelement in the document<body> - add a chart variable (to contain your chart data)
- add a render method in the document
<head>
1. div Element
Add your div elements to your document <body>. These elements act as the containers for your charts, and you can place them between text, graphics, and other charts on your webpage. Make sure to assign each divelement a unique id (e.g., "myChart1", "myChart1", "myChart3", etc.).
Note: Creating a dashboard from multiple charts usually requires more complex HTML and CSS knowledge.
<body>
  <!-- Unique div element identifier for each new chart -->
    <div class="chart--main">
      <div class="chart--row">
        <div id="myChart1" class="chart--container"></div>
      </div>
      <div class="chart--row">
        <div id="myChart2" class="chart--container"></div>
        <div id="myChart3" class="chart--container"></div>
      </div>
    </div>
</body>
2. Chart Configuration
Insert your chart variables in the document <head>. These variables store your chart data. Make sure to assign each variable a unique variable name (e.g., chartConfig1, chartConfig2, etc.).
Note: Variable names are case-sensitive. chartConfig1 is not the same thing as ChartConfig1.
Within each variable, insert your chart data. Remember that at a minimum, you need to provide your chart type and series data.
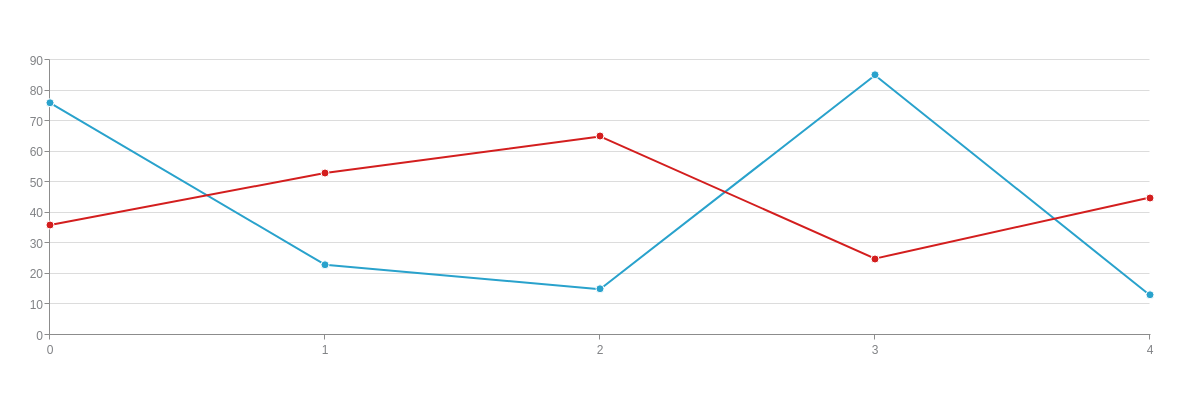
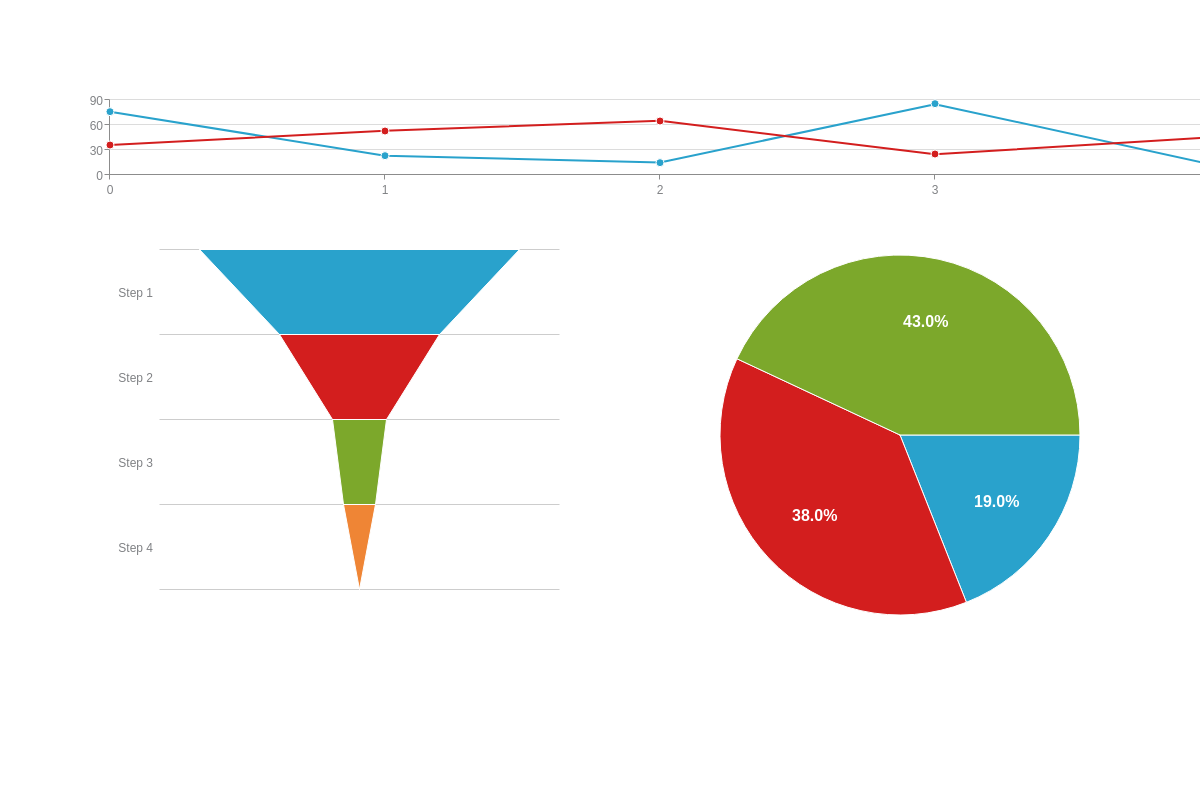
<head>
...
<script>
  /* Unique variable names and chart data */
  let chartConfig1 = {
    type: 'line',
    series:[
      {
        values:[76,23,15,85,13]
      },
      {
        values:[36,53,65,25,45]
      }
    ]
  };
  let chartConfig2 = {
    type: 'funnel',
    series:[
      {values:[30]},
      {values:[15]},
      {values:[5]},
      {values:[3]}
    ]
  };
  let chartConfig3 = {
    type: 'pie',
    series:[
      {values:[15]},
      {values:[30]},
      {values:[34]}
    ]
  };
  /* Your render methods are added after this. */
...
</script>
</head>
3. Render Method
Finally, add your render methods to the document <head> inside the window.addEventListener('load', function() {...}) event handler. Make sure to include your chart's div element (by its unique id) and variable (by its variable name).
<head>
...
<script>
...
  /* Your variables and chart data are added before this. */
  window.addEventListener('load', function() {

    let chartConfig1 = {...};
    let chartConfig2 = {...};
    let chartConfig3 = {...};

    /**
    * Render methods, which reference your charts'
    * div element identifiers and variable names.
    */
    zingchart.render({
      id: 'myChart1',
      data: chartConfig1,
      height: '100%',
      width: '100%',
    });
    zingchart.render({
      id: 'myChart2',
      data: chartConfig2,
      height: '100%',
      width: '100%',
    });
    zingchart.render({
      id: 'myChart3',
      data: chartConfig3,
      height: '100%',
      width: '100%',
    });
  });
</script>
</head>
Graphset
To create shared features or a contained dashboard, you need to add a graphset array into the document <head>. You then add objects containing your chart data into it. You'll also need to size and position your dashboard to achieve the layout and appearance that you want.
Note: A dashboard chart is different from a mixed chart. A dashboard chart consists of 2 or more separate charts. A mixed chart refers to a single chart that contains 2 or more different plot types (e.g., one plot as a bar and another plot as a line).
1. Graphset Array
Insert a graphset array into the document <head>. For each of your charts, create an object to contain your chart data. (You need to provide your chart type and series data at a minimum.
<head>
...
<script>
 let myDashboard = {
    /* Graphset array */
    graphset: [
      { /* Object containing chart data */},
      { /* Object containing chart data */},
      { /* Object containing chart data */},
    ]
  };
</script>
</head>
2. Sizing and Positioning
You can individually size each chart using the height and width attributes. You can also specify each chart's position within the dashboard using the x and y attributes. We recommend using percentages to allow for proportional scaling. (While pixels offer the advantage of specific placement and control, they do not scale.)
Chart positioning is relative to the top-left corner, and can be specified by percentages or pixels.
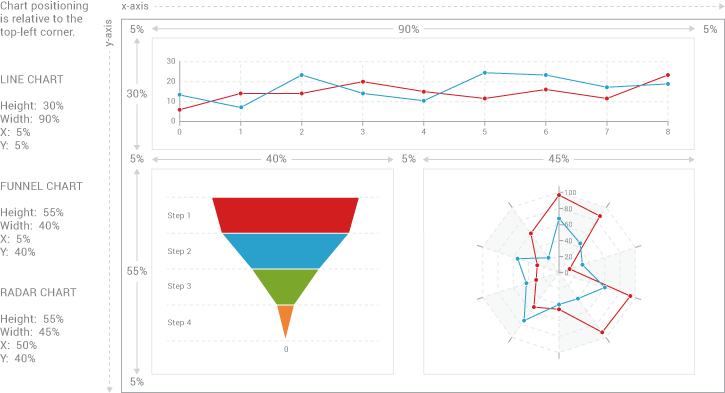
<head>
...
<script>
 let myDashboard = {
    /* Graphset array */
    graphset: [
      { /* Object containing chart data */
        type: 'line',
        /* Size your chart using height/width attributes */
        height: '200px',
        width: '100%',
        /* Position your chart using x/y attributes */
        x: '5%',
        y: '5%',
        series:[
          {
            values:[76,23,15,85,13]
          },
          {
            values:[36,53,65,25,45]
          }
        ]
      },
      { /* Object containing chart data */
        type: 'funnel',
        height: '55%',
        width: '50%',
        x: '5%',
        y: '200px',
        series:[
          {values:[30]},
          {values:[15]},
          {values:[5]},
          {values:[3]}
        ]
      },
      {
        type: 'pie',
        height: '55%',
        width: '50%',
        x: '50%',
        y: '200px',
        series:[
          {values:[15]},
          {values:[30]},
          {values:[34]}
        ]
      }
    ]
  };
</script>
</head>
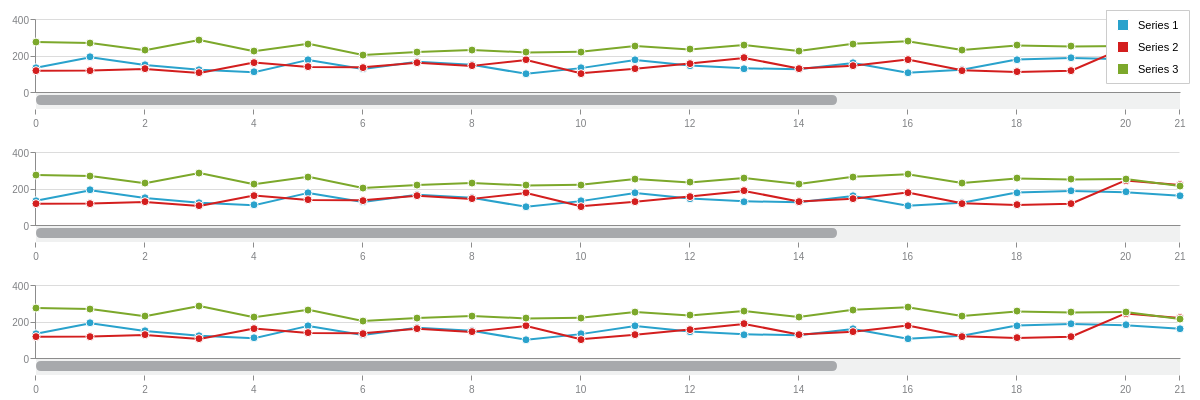
Shared Interactions
One of the greatest benefits for using a graphset is shared chart features. This will allow you to zoom, scroll, pan, and interact with multiple charts at once.
Moving Forward
You should now understand the basics of how to render a chart and the next logical step is complex data scenarios. Check out our data basics tutorial to learn more about importing data dynamically to your charts.