Bubble Charts
Overview
ZingChart supports two bubble chart types:
- Standard
- Horizontal
Note: See our Bubble Chart Gallery for inspiration on all the different bubble chart possibilities.
Bubble Chart Types
Our bubble chart types include the standard bubble chart and the horizontal bubble chart. You can also display multiple charts in a trellis bubble chart.
Bubble Chart
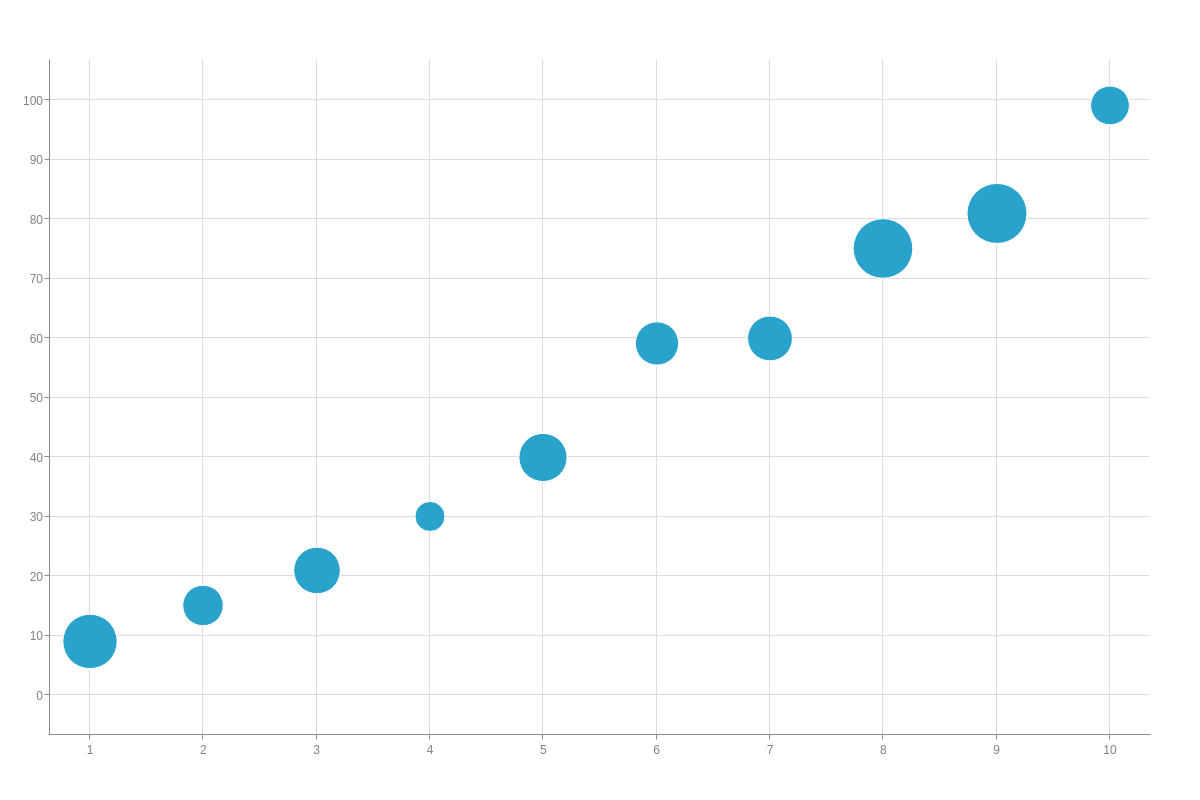
Add a type attribute to your chart object and set the value to bubble. Without further modification, a bubble chart with a single dataset looks like this:
{
  type: "bubble",
  series: [
    {
      values: [
        [1,9,59],
        [2,15,15],
        [3,21,30],
        [4,30,5],
        [5,40,35],
        [6,59,21],
        [7,60,25],
        [8,75,85],
        [9,81,87],
        [10,99,12]
      ]
    }
  ]
}
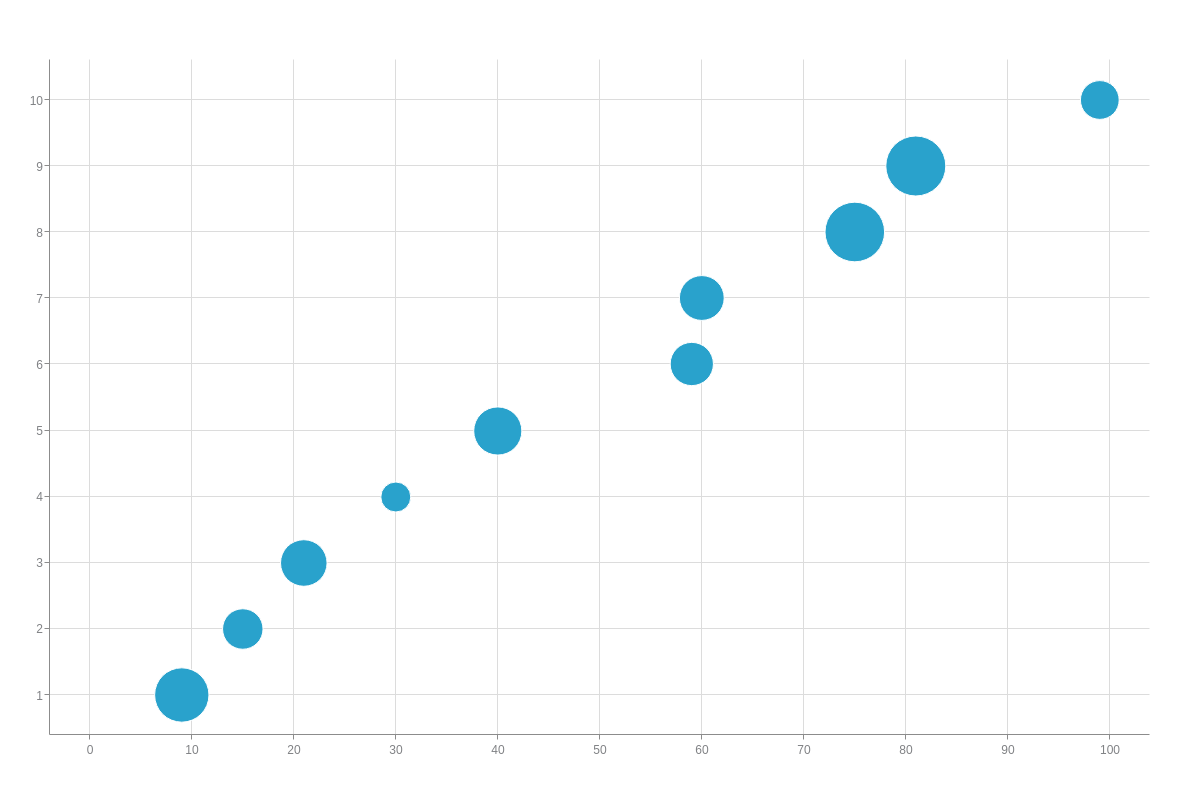
Horizontal Bubble Chart
A horizontal bubble chart is specified by the hbubble value. With this chart type, the axes are switched so that the x-axis runs vertically and the y-axis runs horizontally.
Note: Horizontal bubble charts are especially useful when working with our horizontal mixed charts.
{
  type: "hbubble"
}
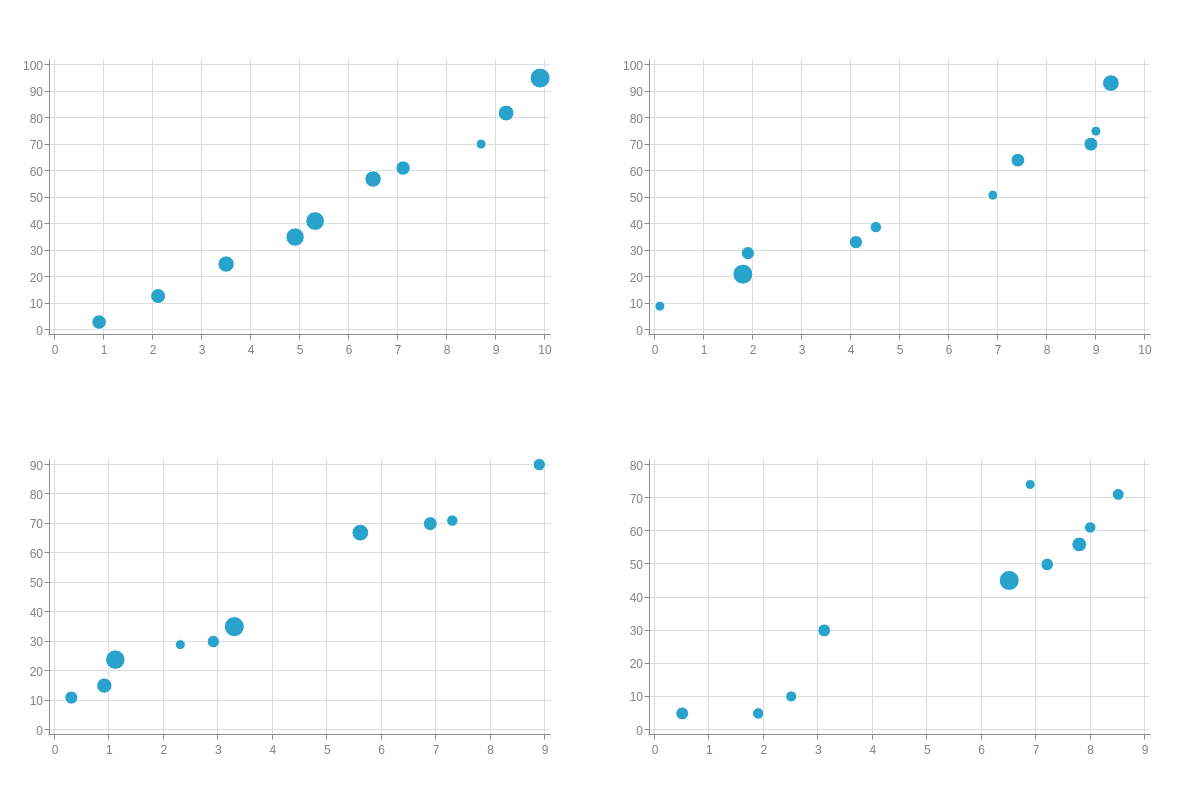
Trellis Bubble Chart
A trellis bubble chart is a series of smaller charts placed into a panel or grid. This chart type is useful for comparing similar or related datasets.
First, create a graphset array; then, place each of your individual chart objects inside it. You can then size and position each chart to fit appropriately inside the trellis.
Note: See our Adding Additional Charts page for more detailed information on trellis charts.
Note: To adjust the spacing between your axis lines and plotted data, add the offset-start and offset-end attributes to your scale-x and/or scale-y object(s). Provide a pixel value.
{
  graphset: [
    {
      type: "bubble",
      height: "50%",
      width: "50%",
      x: "0%",
      y: "0%",
      'scale-x': {
        'offset-start': 5,
        'offset-end': 5
      },
      'scale-y': {
        'offset-start': 5,
        'offset-end': 5
      },
      plot: {
        'min-size': 5,
        'max-size': 10
      },
      series: [
        {
          values: [
            [0.9,3,18],
            [2.1,13,21],
            [3.5,25,33],
            [4.9,35,54],
            [5.3,41,59],
            [6.5,57,34],
            [7.1,61,17],
            [8.7,70,3],
            [9.2,82,28],
            [9.9,95,76]
          ]
        }
      ]
    },
    {
      type: "bubble",
      height: "50%",
      width: "50%",
      x: "50%",
      y: "0%",
      'scale-x': {
        'offset-start': 5,
        'offset-end': 5
      },
      'scale-y': {
        'offset-start': 5,
        'offset-end': 5
      },
      plot: {
        'min-size': 5,
        'max-size': 10
      },
      series: [
        {
          values: [
            [0.1,9,3],
            [1.8,21,60],
            [1.9,29,9],
            [4.1,33,9],
            [4.5,39,4],
            [6.9,51,3],
            [7.4,64,11],
            [8.9,70,12],
            [9,75,3],
            [9.3,93,29]
          ]
        }
      ]
    },
    {
      type: "bubble",
      height: "50%",
      width: "50%",
      x: "0%",
      y: "50%",
      'scale-x': {
        'offset-start': 5,
        'offset-end': 5
      },
      'scale-y': {
        'offset-start': 5,
        'offset-end': 5
      },
      plot: {
        'min-size': 5,
        'max-size': 10
      },
      series: [
        {
          values: [
            [0.3,11,11],
            [0.9,15,21],
            [1.1,24,54],
            [2.3,29,6],
            [2.9,30,9],
            [3.3,35,59],
            [5.6,67,30],
            [6.9,70,14],
            [7.3,71,7],
            [8.9,90,9]
          ]
        }
      ]
    },
    {
      type: "bubble",
      height: "50%",
      width: "50%",
      x: "50%",
      y: "50%",
      'scale-x': {
        'offset-start': 5,
        'offset-end': 5
      },
      'scale-y': {
        'offset-start': 5,
        'offset-end': 5
      },
      plot: {
        'min-size': 5,
        'max-size': 10
      },
      series: [
        {
          values: [
            [0.5,5,8],
            [1.9,5,3],
            [2.5,10,2],
            [3.1,30,8],
            [6.5,45,87],
            [6.9,74,1],
            [7.2,50,7],
            [7.8,56,20],
            [8,61,3],
            [8.5,71,4]
          ]
        }
      ]
    }
  ]
}
Data
Bubble charts support single or multiple datasets, all contained inside the series array. Each dataset is configured as an array of arrays where users specify their x-axis, y-axis, and bubble values in the following format:
{
  values: [
    [x1, y1, bubble1],
    [x2, y2, bubble2],
    ...,
    [xN, yN, bubbleN]
  ]
}
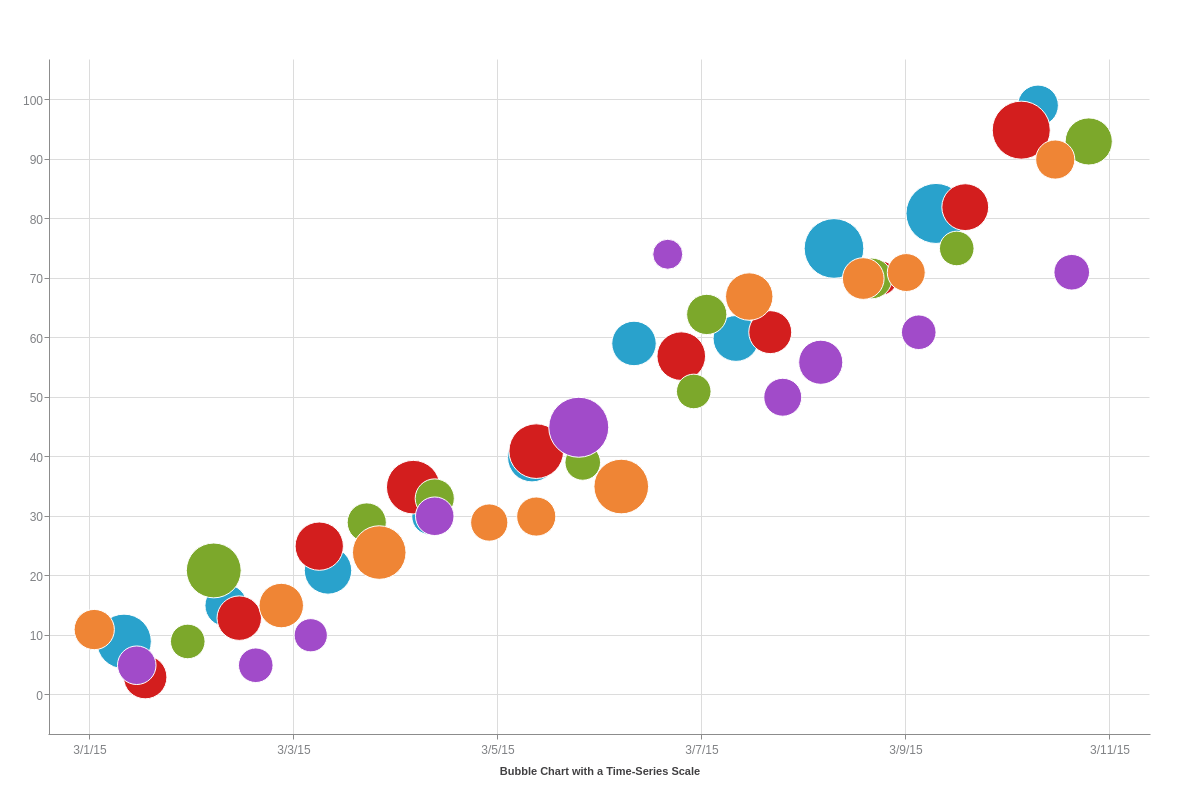
Note: For users working with time-series data, it must be provided in Unix time in milliseconds. You can convert your dates into Unix time with online conversion tools such as Epoch Converter. Our Time-Series Scale section further below has a bubble chart with a time-series scale and data example.
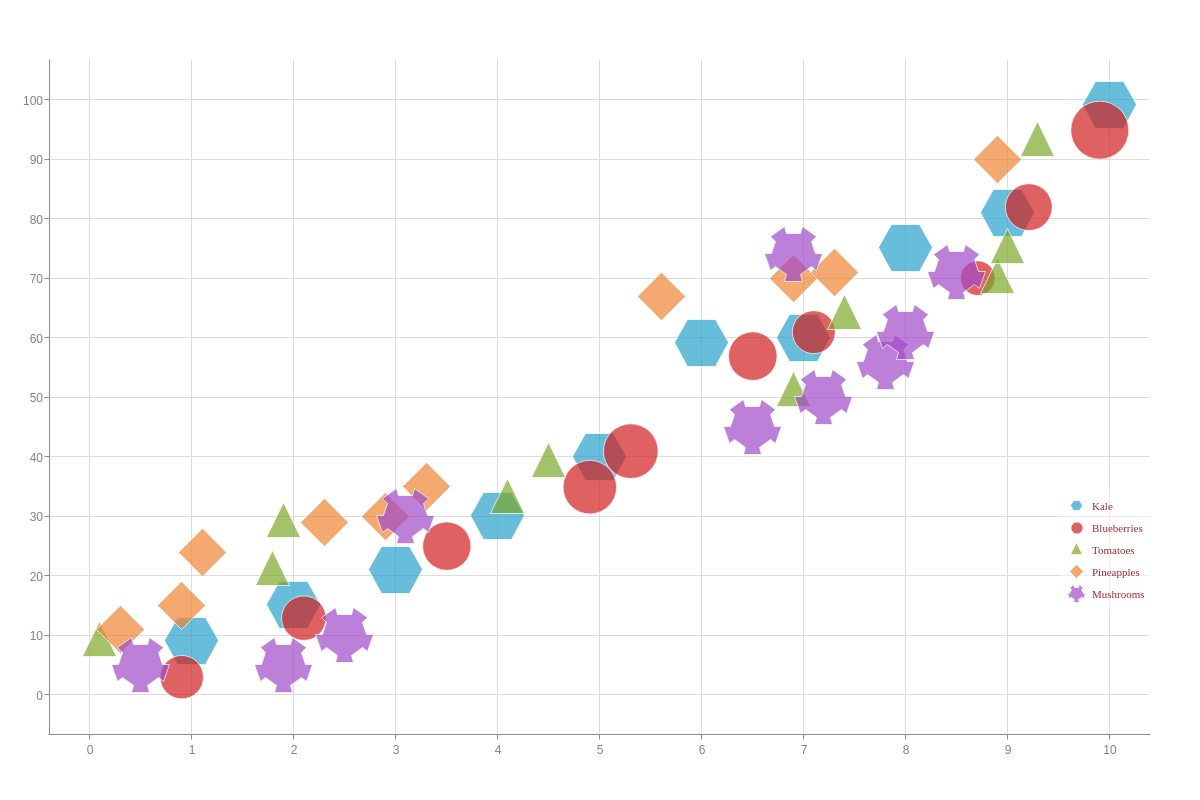
The bubble chart below contains five datasets:
{
  type: "bubble",
  series: [
    {
      values: [
        [1,9,59],
        [2,15,15],
        [3,21,30],
        [4,30,5],
        [5,40,35],
        [6,59,21],
        [7,60,25],
        [8,75,85],
        [9,81,87],
        [10,99,12]
      ]
    },
    {
      values: [
        [0.9,3,18],
        [2.1,13,21],
        [3.5,25,33],
        [4.9,35,54],
        [5.3,41,59],
        [6.5,57,34],
        [7.1,61,17],
        [8.7,70,3],
        [9.2,82,28],
        [9.9,95,76]
      ]
    },
    {
      values: [
        [0.1,9,3],
        [1.8,21,60],
        [1.9,29,9],
        [4.1,33,9],
        [4.5,39,4],
        [6.9,51,3],
        [7.4,64,11],
        [8.9,70,12],
        [9,75,3],
        [9.3,93,29]
      ]
    },
    {
      values: [
        [0.3,11,11],
        [0.9,15,21],
        [1.1,24,54],
        [2.3,29,6],
        [2.9,30,9],
        [3.3,35,59],
        [5.6,67,30],
        [6.9,70,14],
        [7.3,71,7],
        [8.9,90,9]
      ]
    },
    {
      values: [
        [0.5,5,8],
        [1.9,5,3],
        [2.5,10,2],
        [3.1,30,8],
        [6.5,45,87],
        [6.9,74,1],
        [7.2,50,7],
        [7.8,56,20],
        [8,61,3],
        [8.5,71,4]
      ]
    }
  ]
}
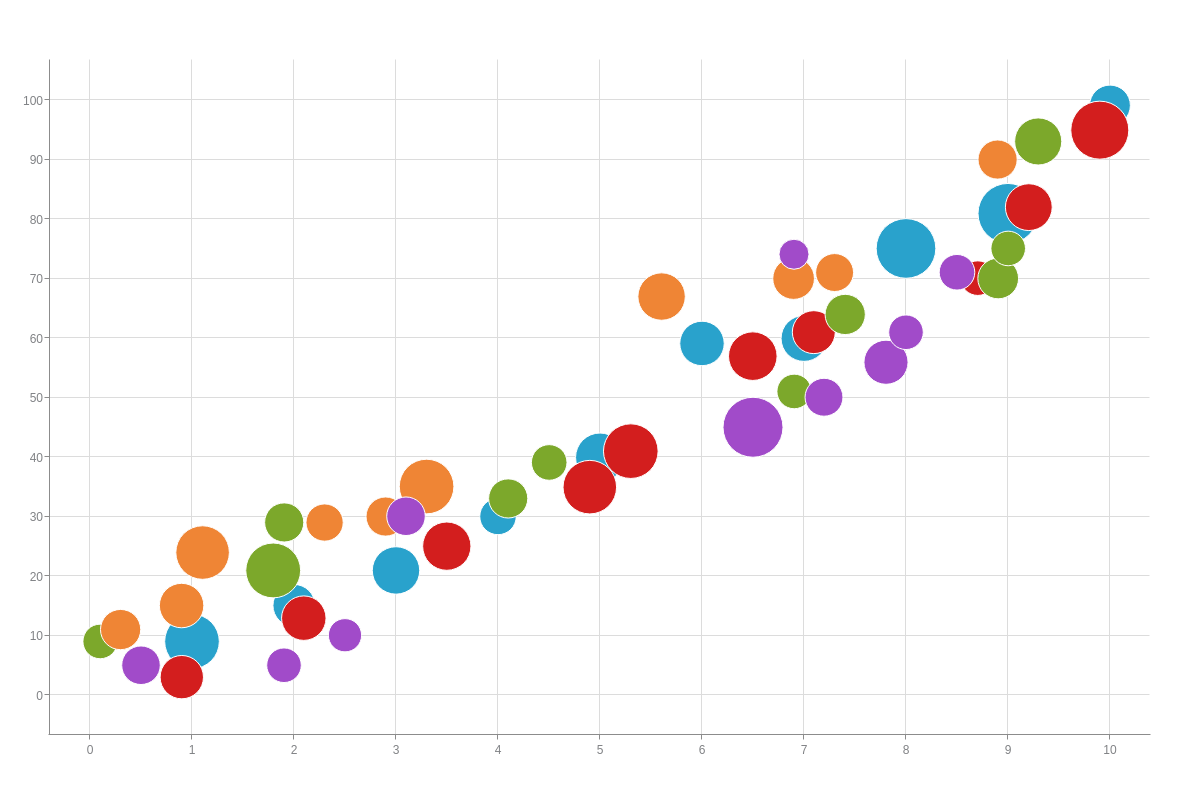
Chart-Specific Properties
Once you've set up your bubble chart, you can next specify the type, sizing, and scaling of your bubble markers.
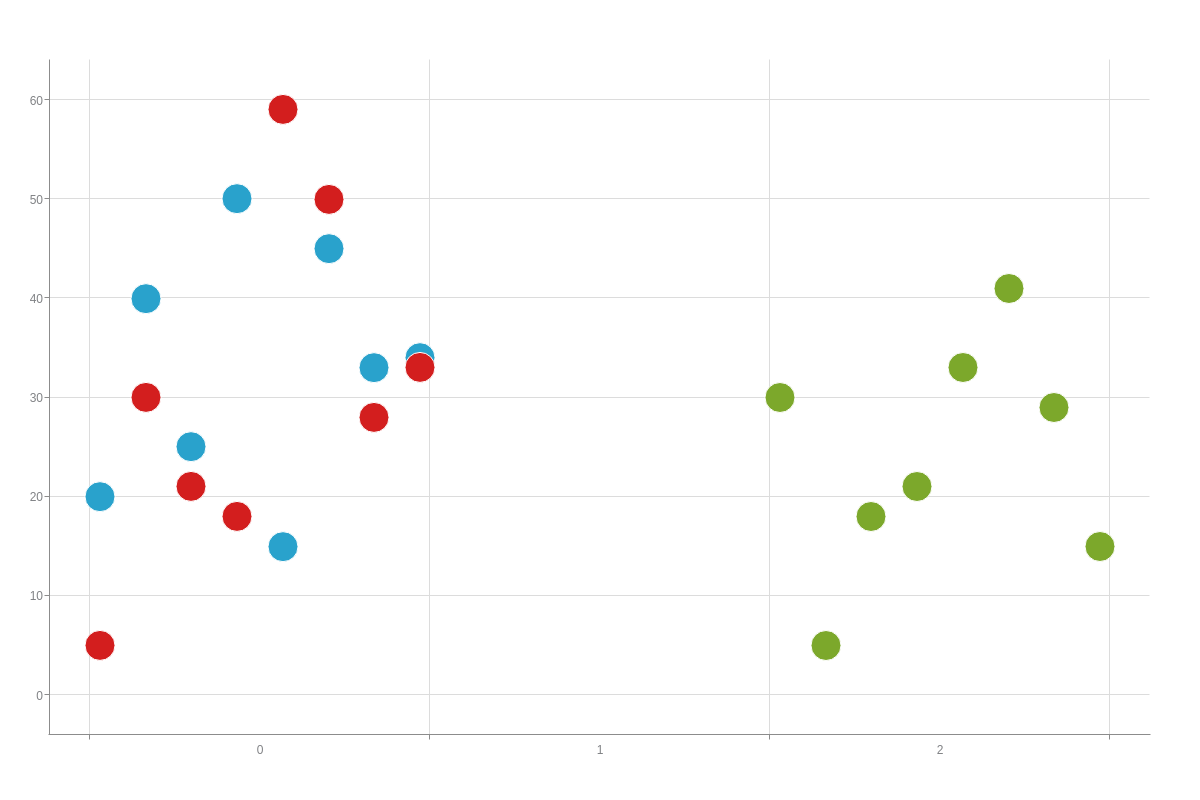
Cluster
Use the clustered attribute to set the entire plot to be placed within one key scale.
The clusterIndex attribute sets which key scale to place the plot in.
To offset the margin of the cluster, use clusterOffset.
These attributes can be used within the plot or series object.
{
  plot: {
    clustered: true,
    clusterOffset: 10,
  },
  series: [{
    clusterIndex: 0,
  }]
}
Markers
In lieu of the standard bubbles, you can use any of our ZingChart markers or even create your own custom markers to represent your data.
Note: Learn more about markers with our Markers tutorials page.
ZingChart Markers
To add markers, create a marker object, insert a type attribute, and specify your marker type. Place the marker object in your plot object for global changes and in your desired series object for local changes.
{
  type: "bubble",
  plot: {
    marker: {
      type: "square"    //Specify your bubble marker type.
    }
  }
}
ZingChart offers over thirty different built-in marker types. Toggle through your marker options in the chart below:

Custom Markers
You can also use your own custom bubble markers. In your marker object, add a background-image attribute. Provide an image link for your custom marker, contained in quotes. You'll want to add the following styling attributes: background-color(set to none) and background-repeat (set to no-repeat). You can also use the size attribute to ensure your entire marker properly displays.
Note: Custom markers, unlike ZingChart markers, will not scale with your bubble value. They remain a fixed size.
{
  type: "bubble",
  series: [
    {
      values: [
        [1,9,59],
        [3,21,30],
        [5,40,35],
        [7,60,25],
        [9,81,87]
      ],
      marker: {
        'background-image': "https://www.zingchart.com/resources/target.png",
        'background-color': "none",
        'background-repeat': "no-repeat",
        size: 12
      }
    },
    {
      values: [
        [2,15,15],
        [4,30,5],
        [6,59,21],
        [8,75,85],
        [10,99,12]
      ],
      marker: {
        'background-image': "https://www.zingchart.com/resources/heart.png",
        'background-color': "none",
        'background-repeat': "no-repeat",
        size: 12
      }
    }
  ]
}

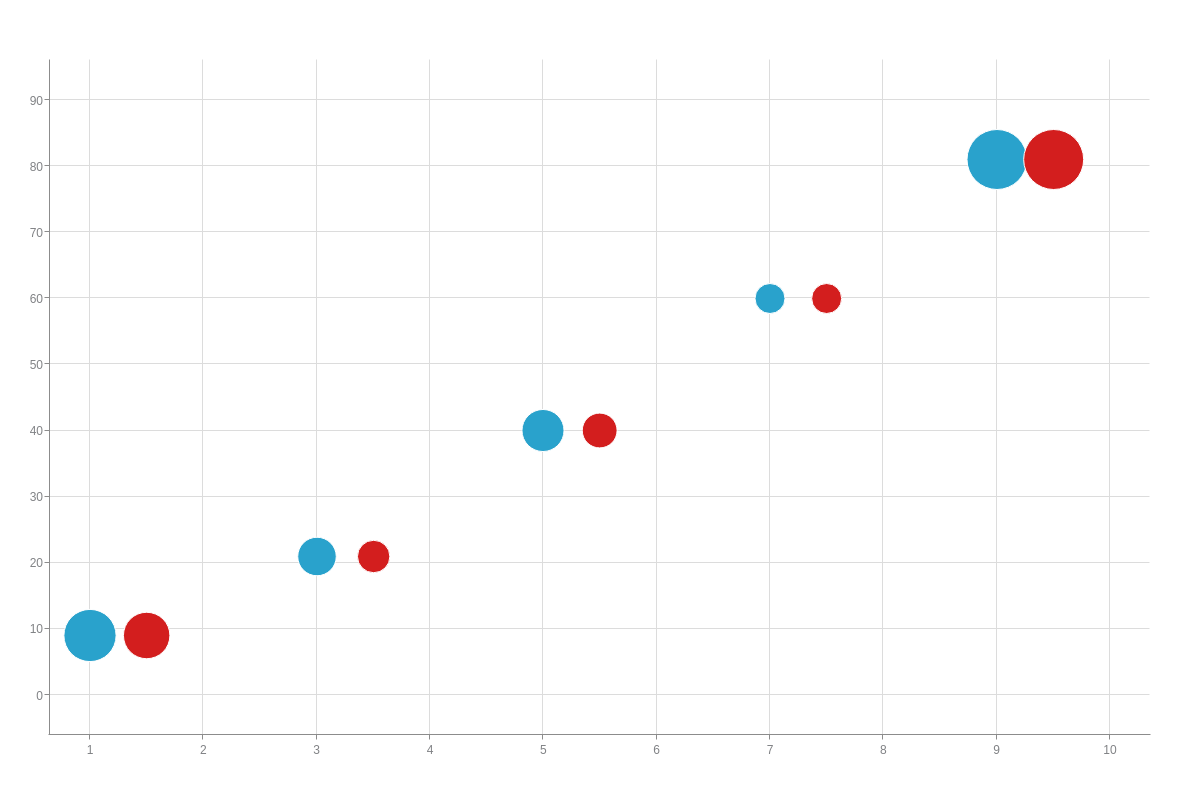
Minimum and Maximum Size
Depending on your data size, you can specify the minimum and/or maximum size a bubble has with the min-size and max-size attributes. Include them in your plot object for global application or to your desired series object for local application. Provide a pixel value.
{
  type: "bubble",
  tooltip: {
    text: "%node-size-value bubble value,<br>with `min-size' and 'max-size' set to %t, respectively"
  },
  series: [
    {
      values: [
        [1,9,59],
        [3,21,30],
        [5,40,35],
        [7,60,25],
        [9,81,87]
      ],
      'min-size':25,  //Provide a pixel value. (Default is 15 pixels.)
      'max-size':100, //Provide a pixel value.
      text: "25 and 100"
    },
    {
      values: [
        [1.5,9,59],
        [3.5,21,30],
        [5.5,40,35],
        [7.5,60,25],
        [9.5,81,87]
      ],
      'min-size':3,   //Provide a pixel value. (Default is 15 pixels.)
      'max-size':10,  //Provide a pixel value.
      text: "3 and 10"
    }
  ]
}

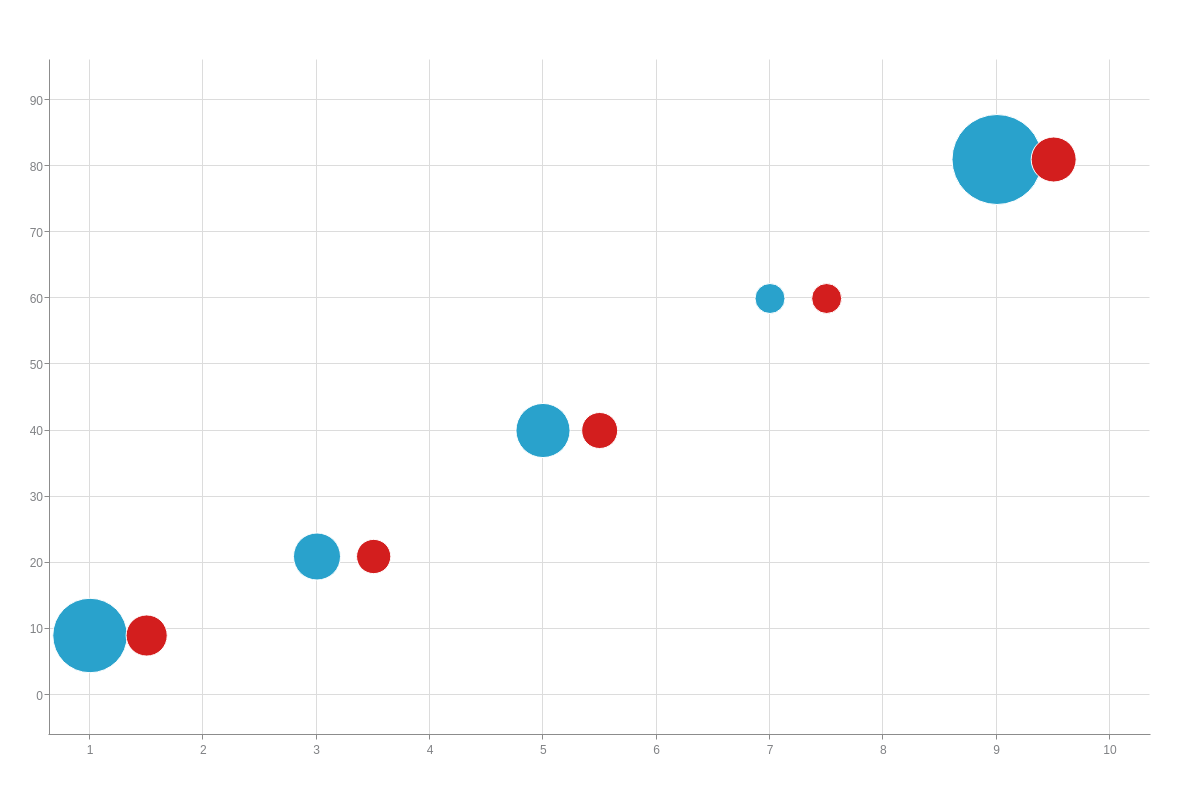
Scaling
Depending on your data range and/or the differences between your data values, you can use the scaling attribute to adjust how your bubble values display. You can apply the change globally by placing the attribute in your plot object or locally by placing it in a specific series object. Specify your value: area (default) or radius (the square root of area).
{
  type: "bubble",
  tooltip: {
    text: "%node-size-value bubble value,<br>with 'scaling' set to '%t'"
  },
  series: [
    {
      values: [
        [1,9,59],
        [3,21,30],
        [5,40,35],
        [7,60,25],
        [9,81,87]
      ],
      scaling: "area",      //"area" (default) or "radius"
      text: "area"
    },
    {
      values: [
        [1.5,9,59],
        [3.5,21,30],
        [5.5,40,35],
        [7.5,60,25],
        [9.5,81,87]
      ],
      scaling: "radius",    //"area" (default) or "radius"
      text: "radius"
    }
  ]
}
Size Factor
You can further modify the size of your bubble markers with the size-factor attribute. Add it to your plot object for global application or to a series object for local application. Provide a value in relation to 1, with values greater than 1 increasing your bubble size and values less than 1 decreasing your bubble size. Note that decimal values should be preceded by a zero.
{
  type: "bubble",
  tooltip: {
    text: "%node-size-value bubble value,<br>with 'size-factor' set to %t"
  },
  series: [
    {
      values: [
        [1,9,59],
        [3,21,30],
        [5,40,35],
        [7,60,25],
        [9,81,87]
      ],
      'size-factor': 2,   //Provide a value in relation to 1.
      text: "2"
    },
    {
      values: [
        [1.5,9,59],
        [3.5,21,30],
        [5.5,40,35],
        [7.5,60,25],
        [9.5,81,87]
      ],
      'size-factor': 0.5, //Provide a value in relation to 1.
      text: "0.5"
    }
  ]
}
Sizing Group
When bubble legend is enabled, use the sizingGroup attribute to set groups for the bubble plot
A bubble legend is generated to show the sizing of bubble for each group of bubbles.
{
  bubbleLegend: { ... },  // enable bubble legend
  series: [{
    sizingGroup: 1,
    ...
  }, {
    sizingGroup: 2,
    ...
  }, {
    sizingGroup: 3,
    ...
    }, {
    sizingGroup: 4,
    ...
  }]
}
Further Customization
Finally, you'll want to configure your scales, style your bubble chart markers, and incorporate value boxes, tooltips, and/or a legend.
Scales
Popular scale types on bubble charts are linear, logarithmic, and time-series scales. Our tutorial for configuring Your X/Y-Axis Scales provides more in-depth information on their setup, but we provide a brief overview here.
Note: While the following sections display scale configurations on the more commonly used axis (scale-x or scale-y), you can generally make the same changes to the opposite axis.
Linear Scale
Our bubble charts display linear scales on both axes by default, with your starting (minimum), ending (maximum), and step scale values automatically calculated based on the data you provide. You can specify your own minimum, maximum, and step scale values by adding a values attribute to your scale-x and/or scale-y object. Provide your min/max/step inside a string separated by colons.
{
  'scale-x': {
    values: "0:10:2"
  },
  'scale-y': {
    values: "0:100:25",
    format: "$%v"
  }
}

Logarithmic Scale
When working with very large data ranges, a logarithmic scale may be useful. To set this scale type, you'll need to add a progression attribute to your scale-y object. Set the value to log. Next, add a log-base attribute. Your base value can be Math.E (e, the base of natural logarithms) or 10.
{
  'scale-y': {
    progression: "log",
    'log-base': 10,
    'thousands-separator': ", "
  }
}

Time-Series Scale
When working with bubble chart time-series data, you'll want a corresponding time-series scale. Generally displayed on the x-axis (scale-x object), you'll need to add a min-value attribute, step attribute, and transform object to create your time-series scale.
For the min-value and step, you'll need to specify your minimum and step scale values in Unix time, provided in milliseconds. (Use an online conversion tool such as Epoch Converter to calculate your Unix timestamps.)
Next, you need to convert your timestamps into a readable format. In your transform object, add a type attribute. Set the value to date. Next, add an all attribute. Specify how you want your scale formatted. You can combine ZingChart tokens with alphanumeric and special characters contained in a string.
Note: Read more on Time-Series Scale in our Scales Tutorial.
{
  type: "bubble",
  utc: true,
  timezone:-8,
  'scale-x': {
    label: {
      text: "Bubble Chart with a Time-Series Scale"
    },
    'min-value':1425196800000,
    step: "2day",
    transform: {
      type: "date",
      all: "%m/%d/%y"
    }
  }
}
Marker Styling
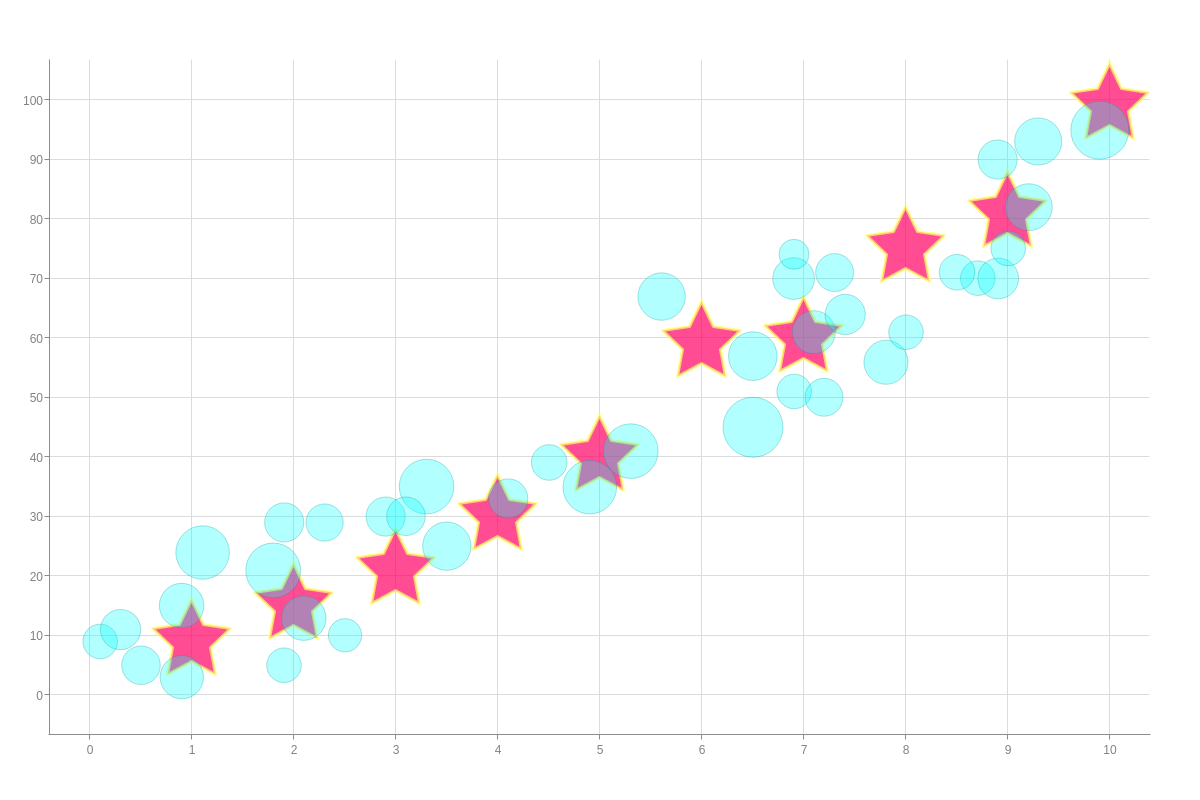
Style your bubble chart's markers with attributes in your marker object. Modify your marker's fill color with the background-color attribute and the color and width of your marker borders with the border-color and border-width attributes. To adjust the transparency levels of your markers, use the alpha attribute and provide a value between 0-1, with 0 being clear and 1 being opaque Note that decimal values should be preceded by a zero.
Note: For more on marker-specific styling, see our ZingChart Shapes Tutorial and Markers JSON Attributes/Syntax page.
{
  type: "bubble",
  plot: {
    marker: { //Apply marker styling globally.
      'background-color': "#00FFFF",
      'border-color': "#009999",
      'border-width': 1,
      alpha:0.3
    }
  },
  series: [
    {
      marker: {  //Apply marker styling locally.
      type: "star5",
      'background-color': "#FF0066", /* hexadecimal or RGB value */
      'border-color': "#FFFF66", /* hexadecimal or RGB value */
      'border-width':3, /* in pixels */
      alpha:0.7
      }
    }
  ]
}
Value Boxes
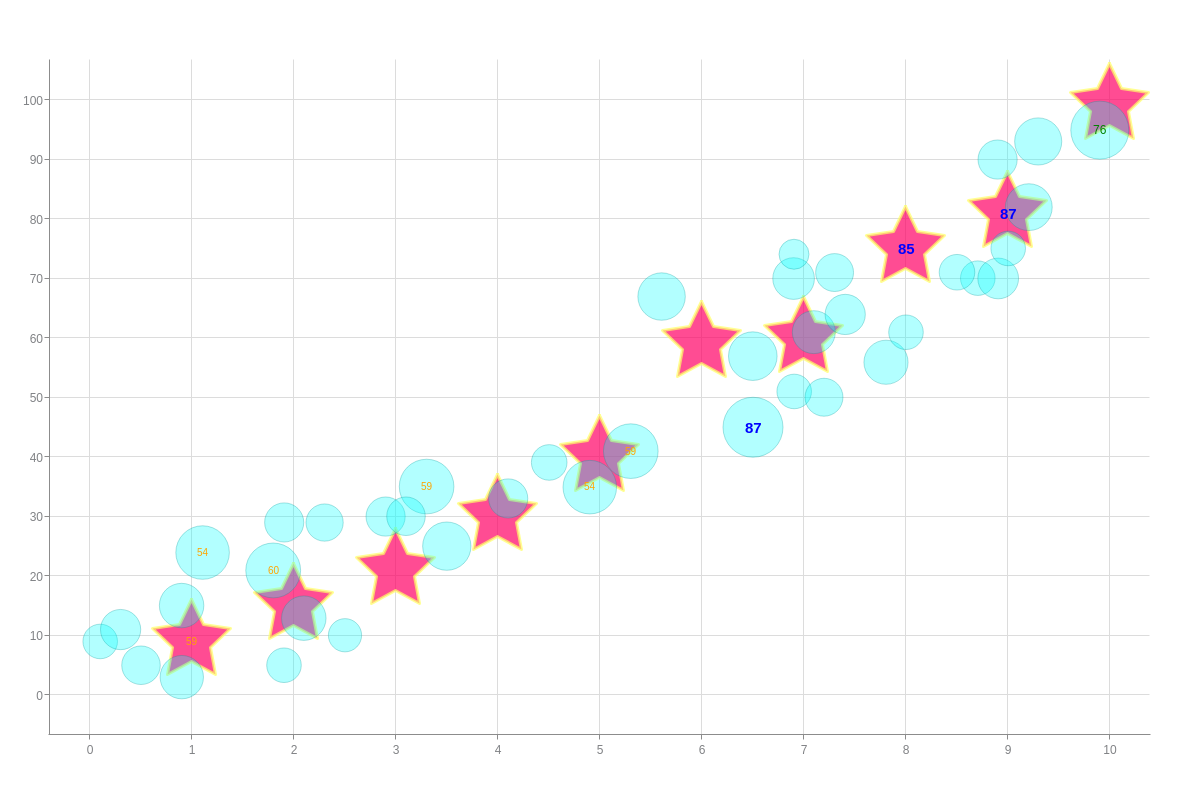
By default, value boxes on bubble charts are not visible. You can make them visible (or selectively visible) by adding a value-box object to your plot object.
Our value boxes can be formatted to display your choice of styling and text, and you can incorporate tokens and a rules attribute for even greater customization. In the following chart, rules were used to color values greater than 80 blue, values between 65-80 green, values between 50-65 orange, and remaining values not visible.
Note: Read more on ZingChart Tokens and Logic Rules in their respective tutorials. Our Value Boxes JSON Attributes/Syntax page provides a more comprehensive list of all your customization options.
{
  type: "bubble",
  plot: {
    'value-box': {
      text: "%node-size-value",  //Use the %node-size-value token to display bubble size.
      rules: [
        {
          rule: "%node-size-value >=80",
          'font-color': "blue",
          'font-size':15
        },
        {
          rule: "%node-size-value >= 65 && %node-size-value < 80",
          'font-color': "green",
          'font-size':12,
          'font-weight': "normal"
        },
        {
          rule: "%node-size-value >= 50 && %node-size-value < 65",
          'font-color': "orange",
          'font-size':10,
          'font-weight': "normal"
        },
        {
          rule: "%node-size-value < 50",
          visible: false
        }
      ]
    }
  }
}
Tooltips
Enabled tooltips by adding a tooltip object to your chart object. You can control their visibility with a visible attribute and value of true (default) or false.
To specify your tooltip text, add a text attribute and place your desired text inside a string. You can use tokens such as %scale-key-value (to represent x-axis values), %node-value (to represent y-axis values), and %node-size-value (to represent bubble size values).
For styling, use attributes such as font-color, font-family, background-color, border-color, and border-width.
Note: Learn more about tooltips with our Tooltips Tutorial. Browse our Tooltips JSON Attributes/Syntax page for more styling options.
{
  type: "bubble",
  tooltip: {
    text: "Bubble Chart Tokens:<br><br>X-axis value is %scale-key-value<br>Y-axis value is %node-value<br>Bubble value is %node-size-value<br><br>Also: %t",
    'font-color': "black",
    'font-family': "Georgia, serif",
    'background-color': "white",
    'border-color': "black",
    'border-width':2
  }
}

Legend
Include a legend in your bubble chart by adding a legend object to your chart object. You can change the layout and position of your legend by using the layout and position attributes, respectively.
To style your legend text, place your styling attributes inside an item object. You can style your legend markers inside a marker object.
Note: Learn more about legends with our Legends Tutorial. Also see our Legends JSON Attributes/Syntax page for more legend customization options.
In our chart below, toggle plots on and off by clicking on the legend marker that a plot is associated with.
{
  type: "bubble",
  legend: {
    layout: "5x1",
    position: "97% 73%",
    item: {
    'font-color': "brown",
    'font-family': "Georgia"
    },
    'background-color': "white",
    alpha:0.5,
    'border-color': "none",
    shadow: false,
    marker: {
    type: "inherit",
    }
  }
}