Value Boxes
Overview
Value boxes are the labels that appear adjacent to the data points on your chart. Able to display any combination of values, text, and/or tokens, they can be applied across an entire series array, to selected series, or to individual data points such as minimum, maximum, first, and/or last values. Refer to the JSON Attributes/Syntax page for Value Boxes for a full list of attribute options.
Note: Value boxes are distinguished from tooltips and crosshairs, which are labels that only appear when a user hovers over the data points.
Formatting
Default Value Boxes
For the majority of ZingChart chart types, value boxes are not visible by default. (Pie charts are a notable exception.) To add value boxes to your chart, go to the plot object and create a value-box object. This will cause all of the plot values to display.
{
  type: 'bar',
  plot: {
    'value-box': {
      //Displays all data values by default.
    }
  },
  'scale-x': {
    labels: [ "Q1", "Q2", "Q3", "Q4" ]
  },
  'scale-y': {
    values: "0:100:25"
  },
  series: [{
    values: [30, 59, 33, 81]
  }, {
    values: [34, 64, 40, 85]
  }]
}
Multiple Value Boxes
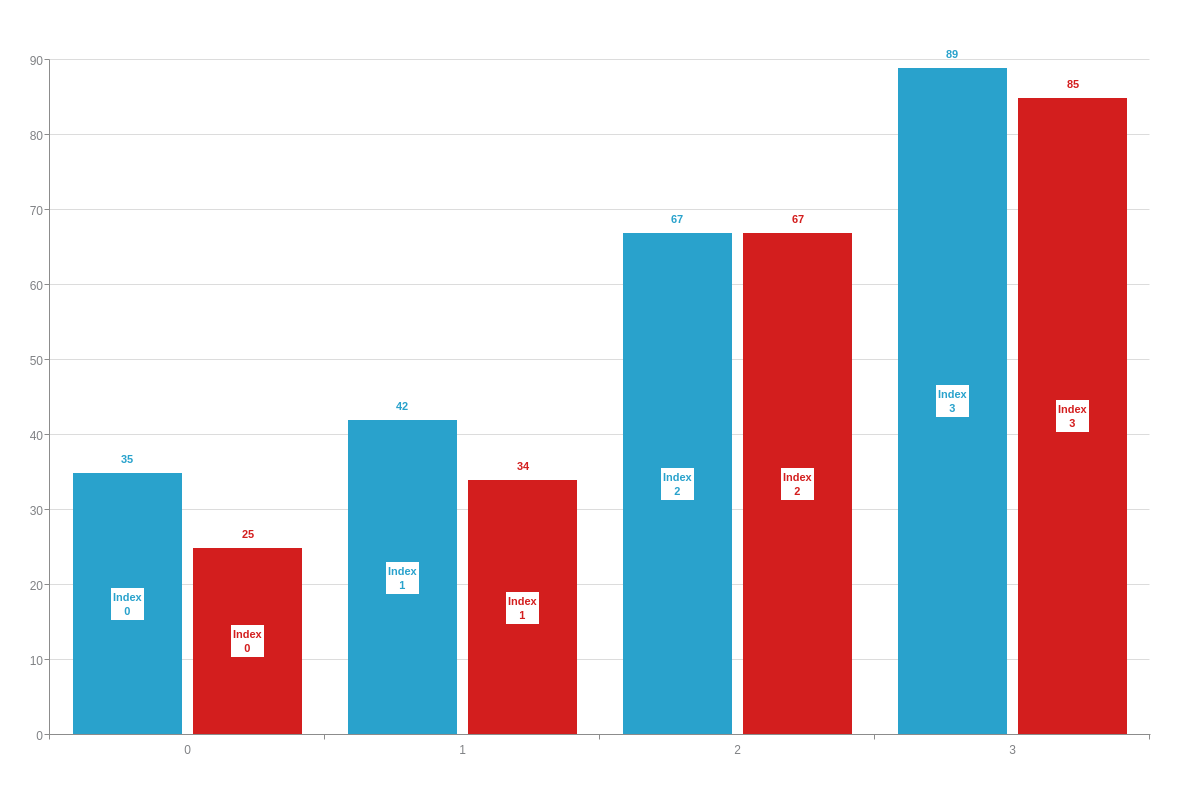
Value boxes can be either a simple object ('value-box': {}) or an array of objects ('value-box': [{},{}]). Configuring value boxes as an array with multiple objects allows you to associate different tokens and text strings to each node while providing different placement and styling to each object.
Text and Tokens
To change the default text, add a text attribute to your value-box object. You can provide any combination of alphanumeric characters and/or ZingChart tokens, such as %v widgets, $%v, or %v %t. Refer to the ZingChart Tokens Tutorial for a full list of available tokens. While tokens such as %v (node values) and %t (plot text) are used across all chart types, there are many tokens that are chart-specific or for specific use cases.
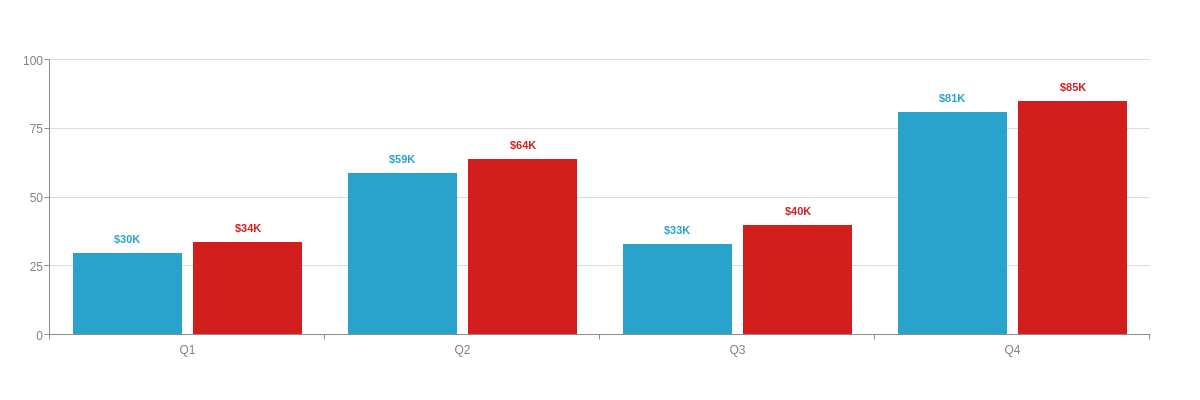
{
  type: 'bar',
  plot: {
    'value-box': {
      text: "$%vK"
    }
  },
  'scale-x': {
    labels: [ "Q1", "Q2", "Q3", "Q4" ]
  },
  'scale-y': {
    values: "0:100:25"
  },
  series: [{
    values: [30, 59, 33, 81]
  }, {
    values: [34, 64, 40, 85]
  }]
}
Type
Value boxes display across all data points in a series by default. To change this, add a type attribute to your value-box object. You can have your value boxes display the minimum (min), maximum (max), first (first), and/or last (last) values. Note that multiple values can be provided, such as type: 'min,max' or type: 'min,max,first,last'. They can also display all (all) or no (none) values.
Note: Another way to specify where data points are placed is to use Logic Rules. Used with ZingChart Tokens, they allow you to create custom rules on how to display value boxes. See our Incorporating Rules section below.

{
  type: 'bar',
  plot: {
    'value-box': {
      text: "$%vK",
      type: "max" //all (default), min, max, first, last, and/or none
    }
  },
  'scale-x': {
    labels: [ "Q1", "Q2", "Q3", "Q4" ]
  },
  'scale-y': {
    values: "0:100:25"
  },
  series: [{
    values: [30, 59, 33, 81]
  }, {
    values: [34, 64, 40, 85]
  }]
}
Placement
Use the placement attribute to specify where value boxes are placed in relation to the data points. The placement options vary based on the chart type. The following values are currently available:
| Chart Type | Placement Options |
|---|---|
| Area Chart | auto | top | bottom | left | right | over |
| Bar Chart | top-out(=top) | top-in | middle | bottom-in | bottom-out(=bottom) | over |
| Bubble Chart | top | bottom | left | right | over |
| Heat Map | top | bottom | left | right | over |
| Line Chart | auto | top | bottom | left | right | over |
| Pie Chart | out | in | center |
| Scatter Plot | top | bottom | left | right | over |
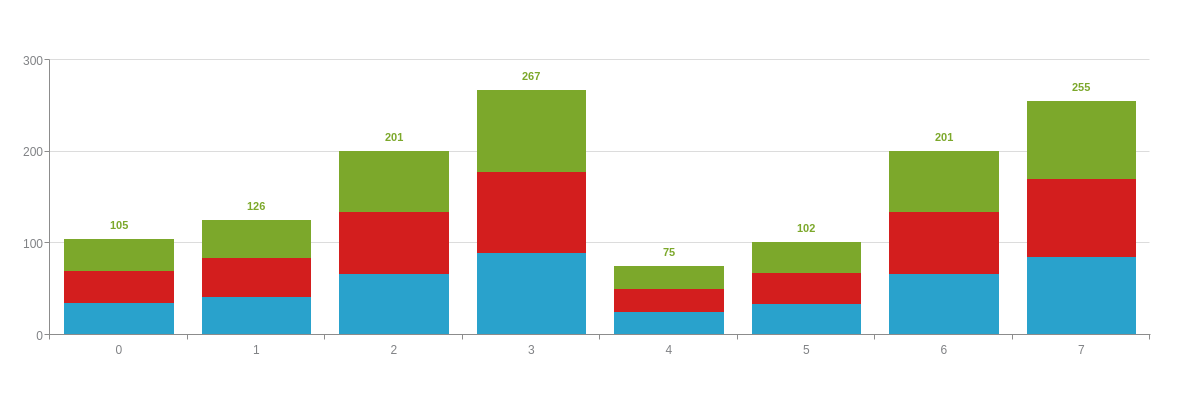
Stacked Charts
Use the %stack-top token and some simple rules to only show valueBox text at the top of a stack.
Note: Depending on the length or size of your value box text, you may need to adjust the offsets. Add an offset-x and/or offset-y attribute, and provide a pixel value.

{
  type: 'bar',
  plot: {
    'value-box': {
      text: "$%vK",
      placement: "top-in",
      'font-color': "white"
    }
  },
  'scale-x': {
    labels: [ "Q1", "Q2", "Q3", "Q4" ]
  },
  'scale-y': {
    values: "0:100:25"
  },
  series: [{
    values: [30, 59, 33, 81]
  }, {
    values: [34, 64, 40, 85]
  }]
}
Angle
You can change the rotation angle of your value boxes with the angle attribute. A positive value turns your value boxes in a clockwise direction. A negative value turns them in a counterclockwise direction. In the example below, the value boxes were turned 270 degrees (or -90).
Note: Sometimes your value box offsets will need to be adjusted. Use the offset-x and/or offset-y attribute(s), and provide a pixel value.
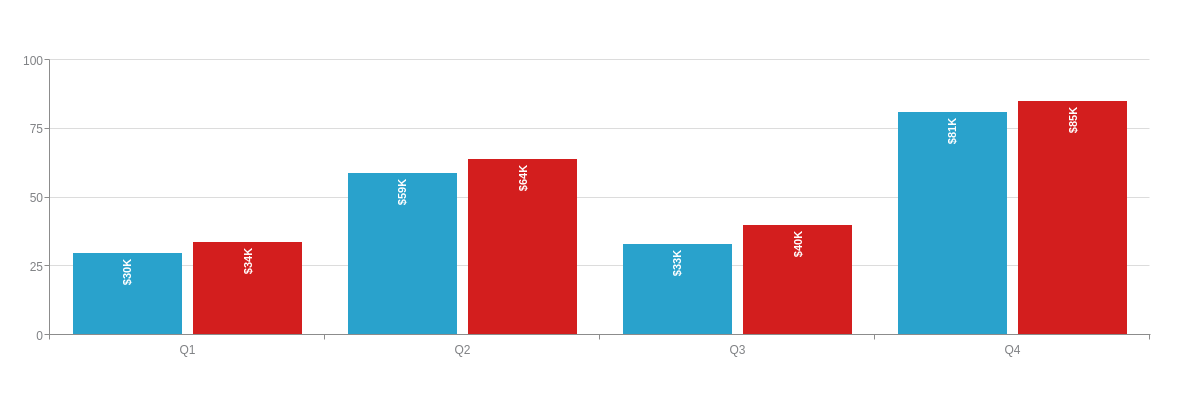
{
  type: 'bar',
  plot: {
    'value-box': {
      text: "$%vK",
      placement: "top-in",
      'font-color': "white",
      angle: -90,
      'offset-y': 5
    }
  },
  'scale-x': {
    labels: [ "Q1", "Q2", "Q3", "Q4" ]
  },
  'scale-y': {
    values: "0:100:25"
  },
  series: [{
    values: [30, 59, 33, 81]
  }, {
    values: [34, 64, 40, 85]
  }]
}
Styling
Font Styling
To style your value box text, use styling attributes such as font-color (provide a hexadecimal or RGB value), font-family, font-size, font-weight (normal or bold), or font-style (normal or italic). Browse the Value Boxes JSON Attributes/Syntax page for more styling options.

{
  type: 'bar',
  plot: {
    'value-box': {
      text: "$%vK",
      'font-color': "#666699",
      'font-family': "Georgia",
      'font-size': 15,
      'font-weight': "normal",
      'font-style': "normal"
    }
  },
  'scale-x': {
    labels: [ "Q1", "Q2", "Q3", "Q4" ]
  },
  'scale-y': {
    values: "0:100:25"
  },
  series: [{
    values: [30, 59, 33, 81]
  }, {
    values: [34, 64, 40, 85]
  }]
}
Box Styling
To style the background color and borders of your value boxes, use styling attributes such as background-color, border-color, border-width, line-style (solid, dotted, dashed, or dashdot), and shadow (true or false). To adjust the padding around your value box text, create a padding attribute and provide a percentage value. You can also add callout arrows by creating a callout attribute and setting the value to true. Refer to the Value Boxes JSON Attributes/Syntax page for additional styling attributes.
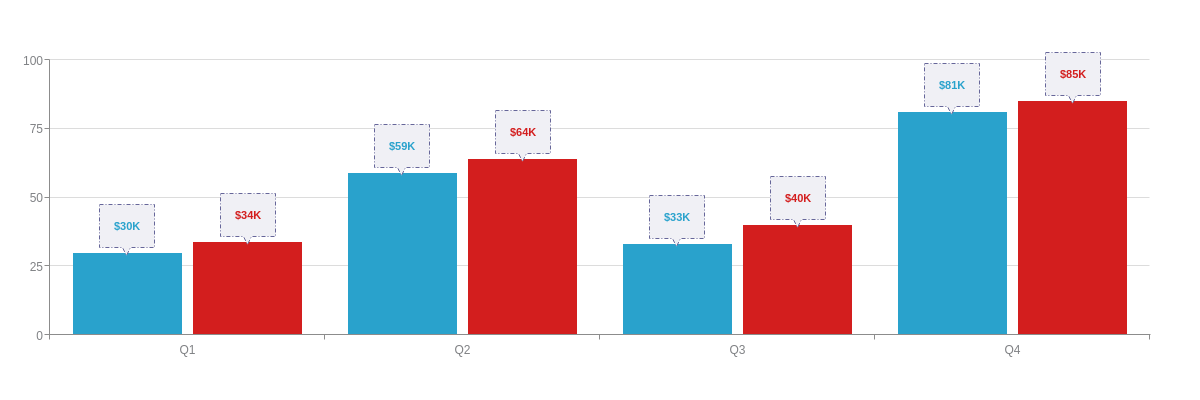
{
  type: 'bar',
  plot: {
    'value-box': {
      text: "$%vK",
      'background-color': "#f0f0f5",
      'border-width': 1,
      'border-color': "#666699",
      'line-style': "dashdot",
      shadow: false,
      padding: "15%",
      callout: true
    }
  },
  'scale-x': {
    labels: [ "Q1", "Q2", "Q3", "Q4" ]
  },
  'scale-y': {
    values: "0:100:25"
  },
  series: [{
    values: [30, 59, 33, 81]
  }, {
    values: [34, 64, 40, 85]
  }]
}
Incorporating Rules
You can format and style your value boxes based on specified conditions. Read our Logic Rules Tutorial and ZingChart Tokens Tutorial for more in-depth information. Rules allow you to dictate which values appear, as well as how they are formatted and styled, so that you can draw greater attention to outliers, notable data clusters, and so on. To get started, create a rules array. Inside the array, create an object for each new rule. Each object must contain a rule (rule attribute) and attributes for what happens what the rule is met.
Note: Rules are not limited to value boxes. In the example below, a rules array was also added to the plot object to color the bars based on their data values.
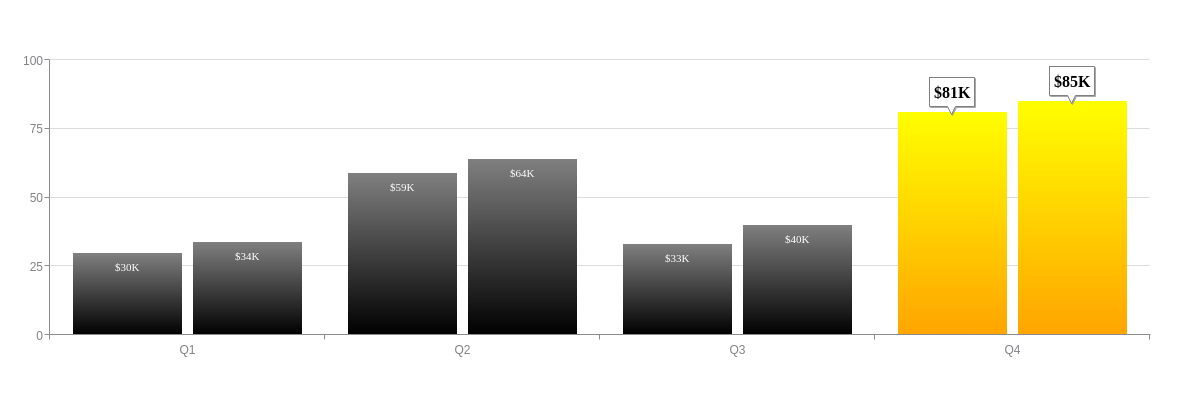
{
  type: 'bar',
  plot: {
    'value-box': {
      text: "$%vK",
      'font-family': "Georgia",
      rules: [{
        rule: "%v >= 75",
        placement: "top-out",
        'font-color': "black",
        'font-size': 16,
        'background-color': "white",
        'border-color': "gray",
        'border-width': 1,
        padding: "5%",
        callout: true
      }, {
        rule: "%v < 75",
        placement: "top-in",
        'font-color': "white",
        'font-weight': "normal"
      }]
    },
    rules: [{
      rule: "%v >= 75",
      'background-color': "yellow orange"
    }, {
      rule: "%v < 75",
      'background-color': "gray black"
    }]
  },
  'scale-x': {
    labels: [ "Q1", "Q2", "Q3", "Q4" ]
  },
  'scale-y': {
    values: "0:100:25"
  },
  series: [{
    values: [30, 59, 33, 81]
  }, {
    values: [34, 64, 40, 85]
  }]
}
Summary
Value boxes are labels that show a node's value, displayed on or near a node. Value boxes allow your users to quickly glean the exact value of a node without having to interact with the chart (such as hovering the node). They are most useful when there are discrete data points on your chart, such as a bar or pie chart.
For a full list of value box attributes, see the JSON configuration page.