Real-Time Feeds
Making Real-Time Feeds
Overview
ZingChart offers a great way to present your data using the refresh/feed system. This can be especially useful when using an external data source.
Basics
Feeds are configured using a "refresh" object within your main graph object.
The first attribute of the "refresh" object should be the type attribute. This attribute can take one of two values: "feed" or "full".
- Feed: The chart updates dynamically as each value is fed in.
- Full: The chart will only update when there are enough new values to do a full chart refresh.
The next attribute required is the "transport" attribute. This attribute will accept "http", "js", or "websockets".
- HTTP: Specify a url from which values will be fed to the chart via HTTP.
- JS: Use a JavaScript function to pass values to the chart.
- WebSockets: Use a WebSockets server to feed values.
Each of the above 3 transport types use the "url" attribute, whether it be to access a PHP file on a server in the case of HTTP transport, call a JavaScript function for JS transport, or point to the WebSockets server’s IP address when using WebSockets.
While not a required, it is wise to include the "interval" attribute in your "refresh" object to set the refresh rate for a feed. Values less than 50 will be measured in seconds, while values of 50 and above will be measured in milliseconds. The default value is 10 (seconds).
HTTP
Transporting data from your server to the client is most commonly done using HTTP requests. This is a simple method to provide near real-time data to your charts. Simply configure a file on your server to return your chart values and then configure the refresh object in ZingChart to use your data.
First, configure your server-side file to return a JavaScript array containing the chart values. For the purpose of this example, we are using the following .php file called feed.php:
< ? php$min = isset($_GET[ 'min' ]) ? intval($_GET[ 'min' ]) : 0;
$max = isset($_GET[ 'max' ]) ? intval($_GET[ 'max' ]) : 50;
$plots = isset($_GET[ 'plots' ]) ? intval($_GET[ 'plots' ]) : 1; ? > [{
  < ? php
  for ($plot = 0; $plot < $plots; $plot++) {
    ? > "plot<?php echo $plot; ?>" : < ? php echo rand($min, $max); ? > , < ? php
  } ? > "scale-x" : "<?php echo date('H:i:s'); ?>"
}]
This file uses isset() to determine whether or not a variable is already set in the URL. If true, it uses the URL values for those variable; if false, it sets the default value to the value found after the colon.
Next, an object is created within an array containing a value for each plot, as well as a current timestamp on "scale-x". Here is a sample of what could be returned by our feed script when $plots=1:
[{
  plot0: 51,
  'scale-x': "13:32:58"
}]
And when $plots=2:
[{
  plot0: 3,
  plot1: 18,
  'scale-x': "13:33:48"
}]
With the server-side script returning the data in the proper format, the only thing left to do is to configure ZingChart to use that data.
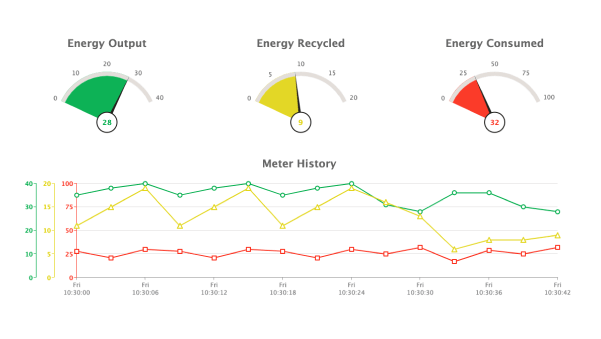
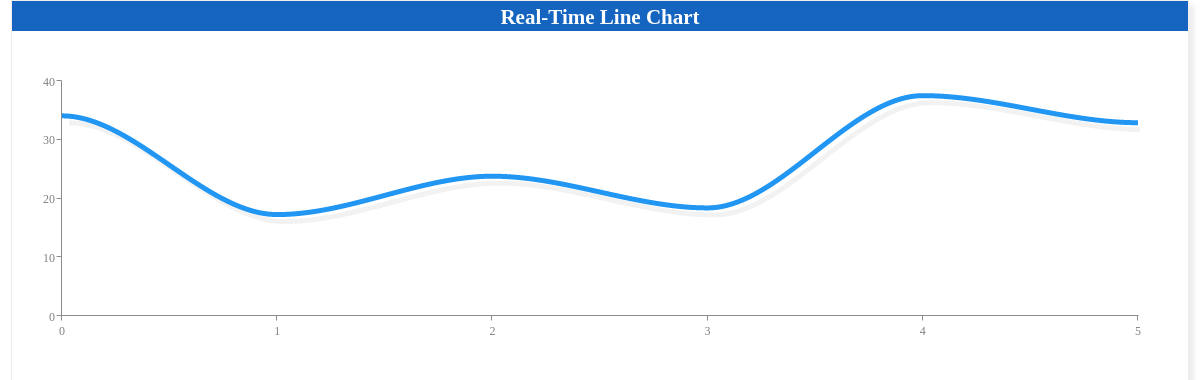
refresh: {
  type: 'feed',
  transport: 'http',
  url: 'https://us-central1-zingchart-com.cloudfunctions.net/public_http_feed?min=0&max=50&plots=2',
  interval: 200
}
The HTTP transport method is the method that you would likely choose for creating a live connection with a database. For more information on using database data, check out our database tutorial.
JS
If your data source is not configured in the format required by ZingChart, you may need a JavaScript function which will act as a "proxy". That JS function can fetch the data in the existing format, extract the needed values, and create a valid packet for ZingChart feeds.
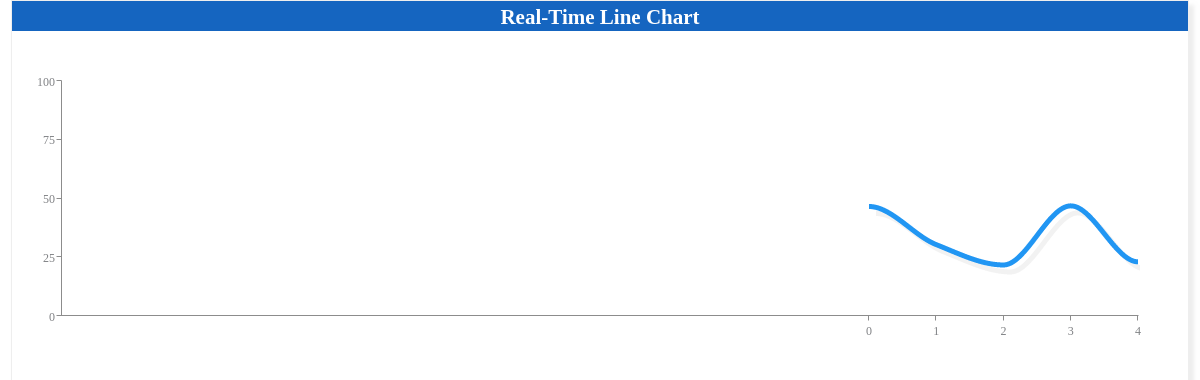
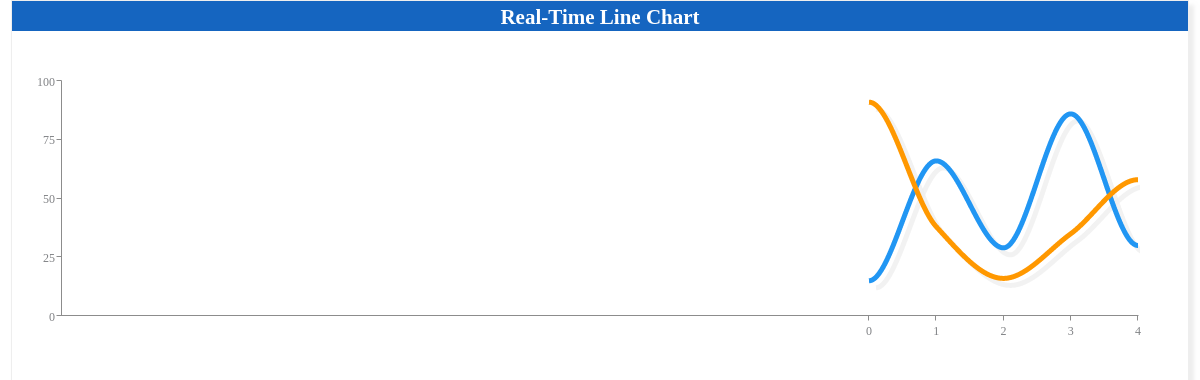
Here, we’ve created a feed() function that generates a random value, assigns it to a "plot0" attribute, and stringifies it using a callback that executes when the parent method completes:
function realTimeFeed(callback) {
  var tick = {};
  tick.plot0 = parseInt(10 + 90 * Math.random(), 10);
  tick.plot1 = parseInt(10 + 90 * Math.random(), 10);
  callback(JSON.stringify(tick));
};
To use this in our chart, the following configuration is needed:
refresh: {
  type: 'feed',
  transport: 'js',
  url: 'realTimeFeed()',
  interval: 500,
},
WebSockets
When building scalable, real-time event-driven web applications, the persistent connection created by WebSockets provide the 2-way communication that is needed to ensure your charts are up to date. ZingChart allows you to take advantage of the increased client and server communication to dramatically reduce latency. Additionally, WebSockets gives you the ability to set the "method" attribute to either "push" or "pull".
- Push: Chart refreshes when the server emits a value. You can think of it as the server being in command.
- Pull: Browser issues a request when it wants. The server is still emitting values, and it will need to send all emitted values since the last chart refresh.
For example, if the "reset-timeout" attribute is set to a value of 10, then after every 10 data points, the chart will remove the previous data and refresh. The most important note is the url is prefixed with wss:// and not https://. You can find the full WebSocket example here.
refresh: {
  type: 'feed',
  transport: 'websockets',
  url: 'wss://zingchart-ws-demo.glitch.me',
  method: 'push'
}
Note: The WebSockets server for the above demo is hosted on Glitch https://glitch.com/edit/#!/zingchart-ws-demo.
Timeout Attributes
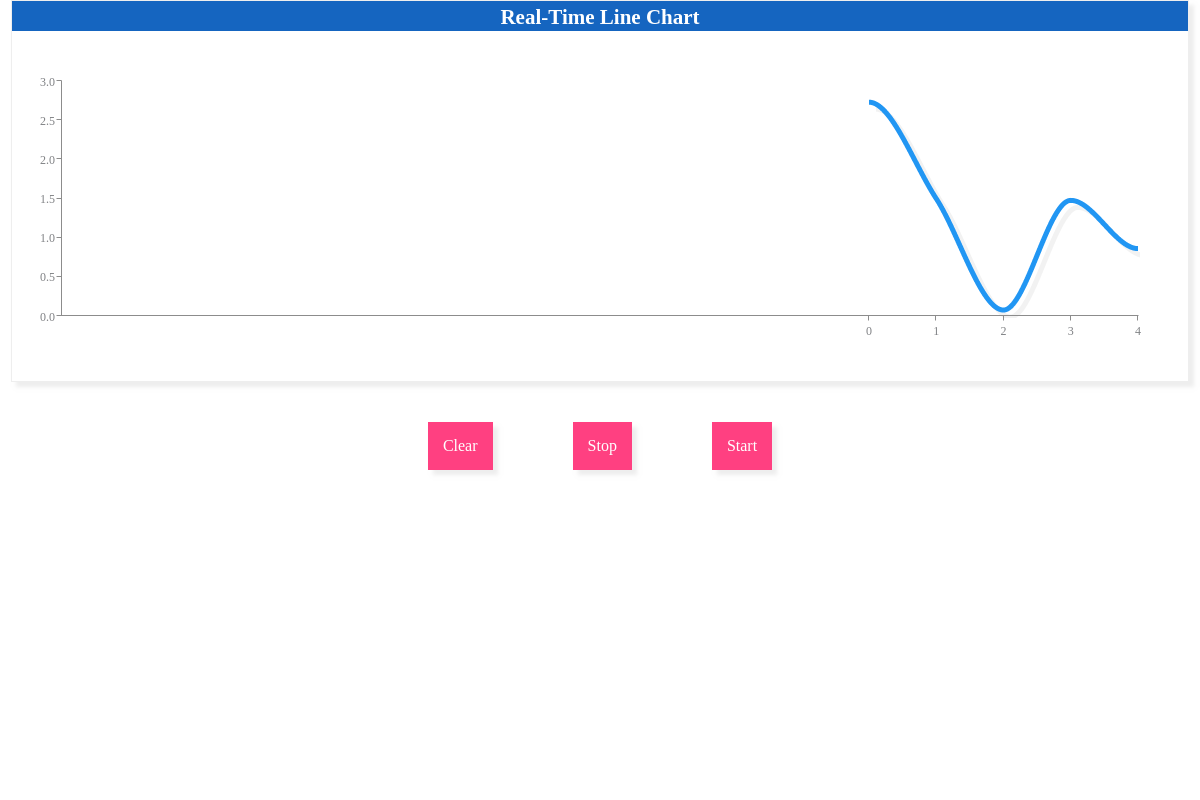
As mentioned previously, the "interval" attribute sets the refresh rate of a chart. Our API provides you with the ability to get and set the interval without re-rendering, through the getinterval() and setinterval() methods. You can try these out below.
Besides "interval", there are two other timing attributes that can be set: "reset-timeout", and "stop-timeout".
- Reset-timeout: Used to determine how many data points to draw before the graph reloads all data from the data feed, removing all of the previous data from the feed.
- Stop-timeout: Used to specify how many data points a chart will draw from the source before it stops.
For example, if the "reset-timeout" attribute is set to a value of 10, then after every 10 data points, the chart will remove the previous data and refresh.
refresh: {
  type: 'feed',
  transport: 'http',
  url: 'https://us-central1-zingchart-com.cloudfunctions.net/public_http_feed?min=0&max=40&plots=1',
  interval:200,
  maxTicks:10,
  adjustScale: true,
  resetTimeout: 10,
}
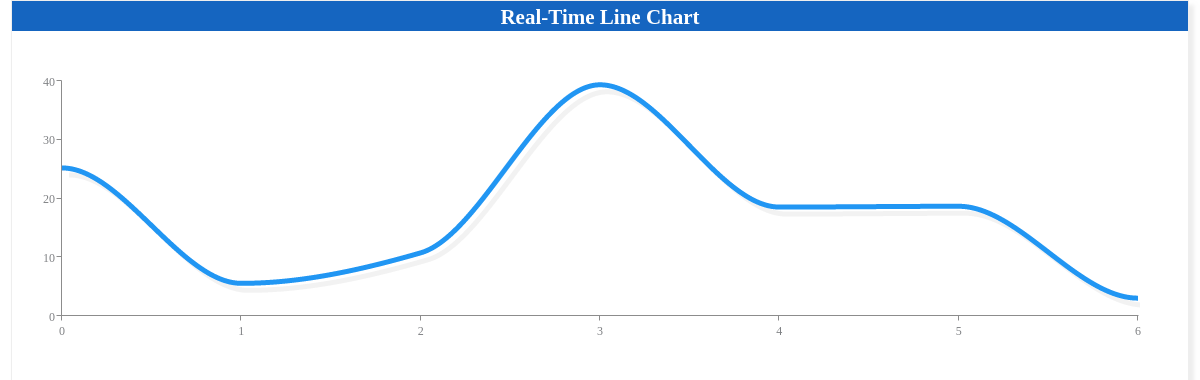
Similarly, if the "stop-timeout" attribute is set to a value of 15, then after 15 data points, the chart will stop accepting new data points.
refresh: {
  type: 'feed',
  transport: 'http',
  url: 'https://us-central1-zingchart-com.cloudfunctions.net/public_http_feed?min=0&max=40&plots=1',
  interval:200,
  maxTicks:10,
  adjustScale: true,
  stopTimeout: 10,
}
Curtain
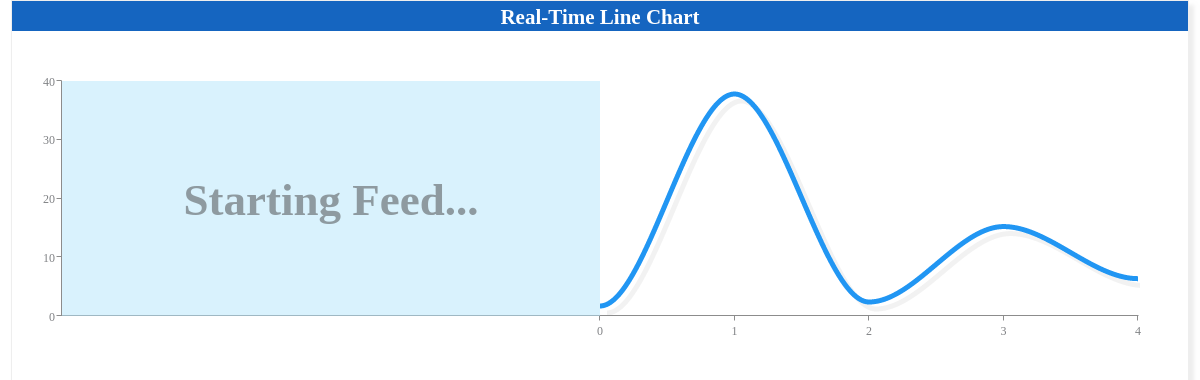
The "curtain" attribute displays a loading pane to the left of the feed as the chart is being updated. As data comes in, the curtain will be pushed to the left until it is completely pushed off of the chart.
refresh: {
  type: 'feed',
  transport: 'http',
  url: 'https://us-central1-zingchart-com.cloudfunctions.net/public_http_feed?min=0&max=40&plots=1',
  interval:200,
  maxTicks:10,
  resetTimeout: 10,
  curtain: {
    text: 'Starting Feed...',
    color: '#424242',
    fontSize: 45,
    backgroundColor: '#b3e5fc',
  }
},
For more information on styling the curtain, please see the "curtain" attributes on our JSON Syntax page.
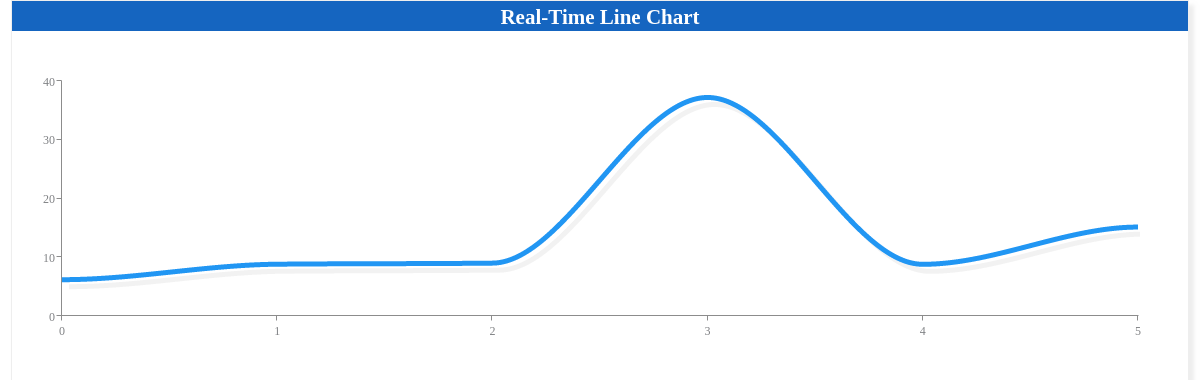
Adjust-Scale
The "adjust-scale" attribute is used to adjust the chart accordingly as more values come in. Setting the "max-ticks" attribute to a certain threshold is used to push values in the chart to the left when new values come in from the right.
refresh: {
  type: 'feed',
  transport: 'http',
  url: 'https://us-central1-zingchart-com.cloudfunctions.net/public_http_feed?min=0&max=40&plots=1',
  interval:200,
  maxTicks:10,
  adjustScale: true,
  resetTimeout: 10,
},
Using setInterval
For a basic update/real time feed, you can use the appendseriesvalues API method on an interval. This will append a value to your chart at whatever interval you set. See the demo below for how to implement a feed with appendseriesvalues. Note: This is not recommended in a production setting; we recommend using the methods detailed above instead.
Summary
As you can see, feeds are a great way to present real-time data on your charts, and have become a very valuable feature in ZingChart. Try them out with any of your live data!
Don't forget, a comprehensive list of available attributes and objects can be found on our JSON Syntax page.