Graphset
Overview
When building charts and dashboards, you may want to consider leveraging the graphset: [] functionality in ZingChart. This is a fairly unique feature which affords a few different benefits. Using graphset: [] is not required to create a chart, however it is required if you want to customize the content-menu, or use features like ZingChart’s history for drilldown charts or shared interactions. You can also set globals: {} for all your charts in a graphset: [].
A graphset: [] provides the ability to create an array of chart objects. This allows you to create multiple charts within a single container on your page.
Getting Started with graphset: []
The first step of a graphset: [] is to create an object:
{}
Then, the graphset: [] array is nested in that object.
// Root object
{
  // Parent container for chart objects
  graphset: []
};
When using the graphset: [] array, you get the benefit of adding multiple chart objects into a single container.
{
  graphset: [
    {}, // Chart 1
    {} // Chart 2
  ]
};
The root object would also hold the configuration for features like modifying your GUI, content-menu, or history for drilldown.
// Root object
{
  gui: {
    contextMenu: {}
  },
  history: {},
  graphset: [
    {}, // Chart 1
    {} // Chart 2
  ]
};
When using the graphset: [] array, you get the benefit of adding multiple chart objects into a single container.
Multiple Charts
When using graphset: [], you can define a single container on your page and pass multiple chart objects with a single request. You also can use cool features like shared interactions or really take advantage of our media rules.
When creating multiple charts in a graphset: [], you can use all the same features in your charts as you normally would. However, you will need to define the layout of your charts within the graphset: []. ZingChart provides some simple options to handle this.
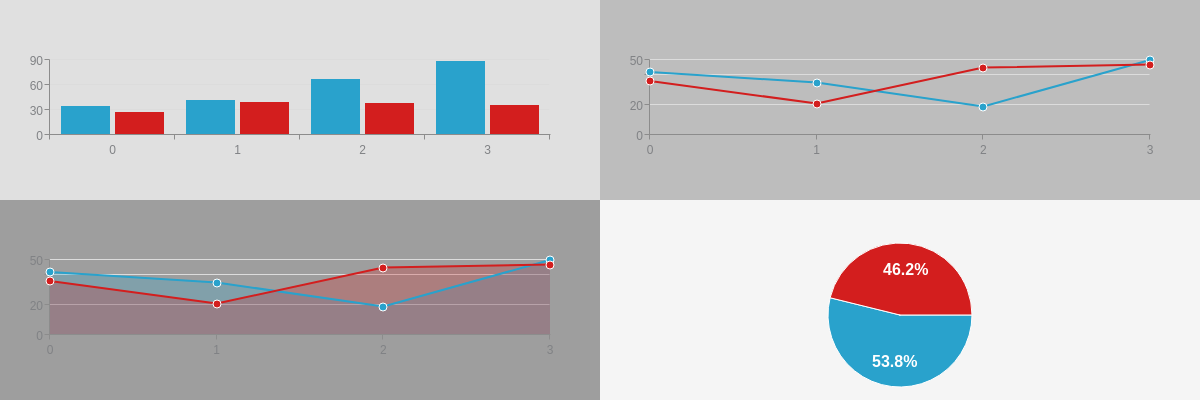
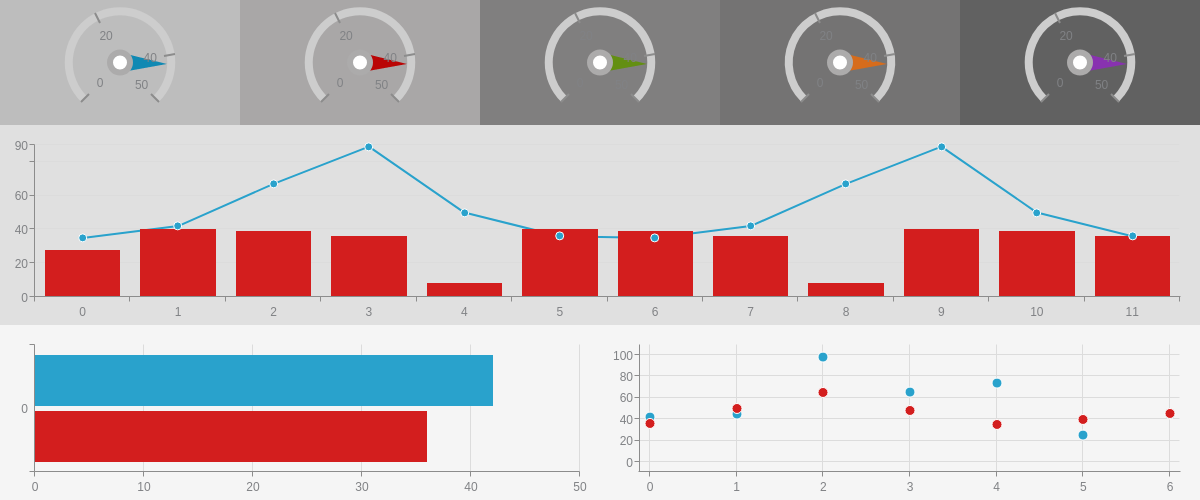
Here is a graphset: [] with 4 charts and no code to modify the layout but different shades of grey have been applied to show you how each chart object is divided by default.
Basic Chart Organization
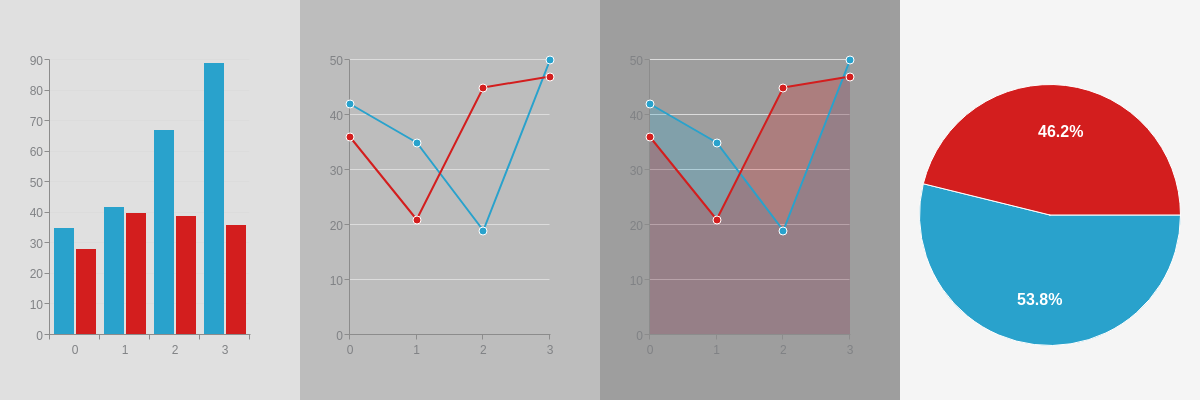
You can define layout: "horizontal" or layout: "vertical" outside of the graphset: [] to change how the charts are oriented.
You can also define layout as some type of grid such as layout: "3x2"
Dashboard Configuration
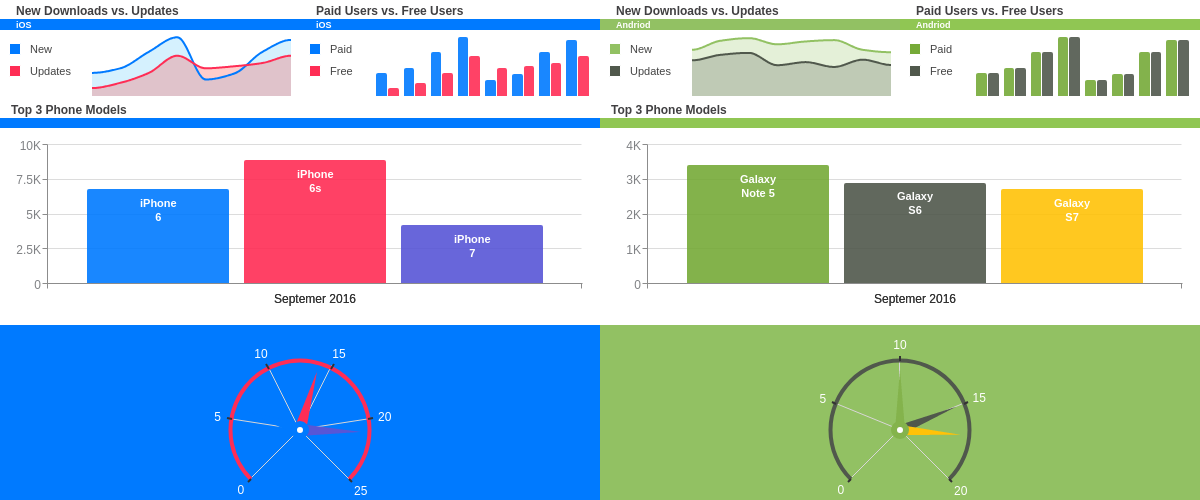
In most cases, you are likely going to want to define some type of custom layout for your graphset: []. Below are a few demos showing you a couple different implementations. There are 5 things you will always do with each chart when organizing a graphset: []:
- Define the height of the specific chart in relation to the entire graphset container.
- Define the width of the specific chart in relation to the entire graphset container.
- Define the x position of the chart.
- Define the y position of the chart.
- Finally, you will modify your
plotarea: {}margins of each chart to ensure they fit correctly.
Tips
x: 0y: 0is the upper left corner of the chart.- Position charts with percentages instead of pixels to help with responsiveness. You can use media rules for fully responsive or adaptive charts.
- Start with setting the backgroundColor of each chart to something different so you can see the spacing between charts. Then, set the backgroundColor to what fits your design best at the end.
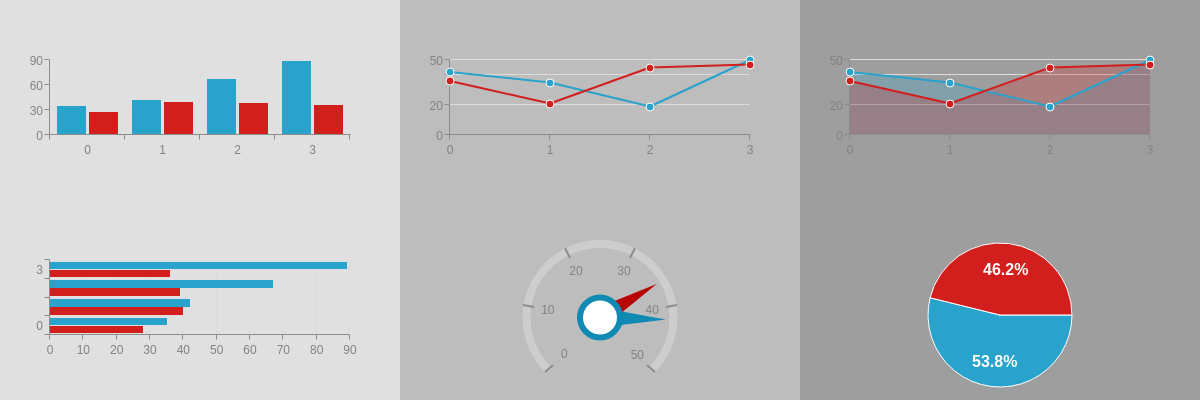
Basic Dashboard Demos
Demo 1
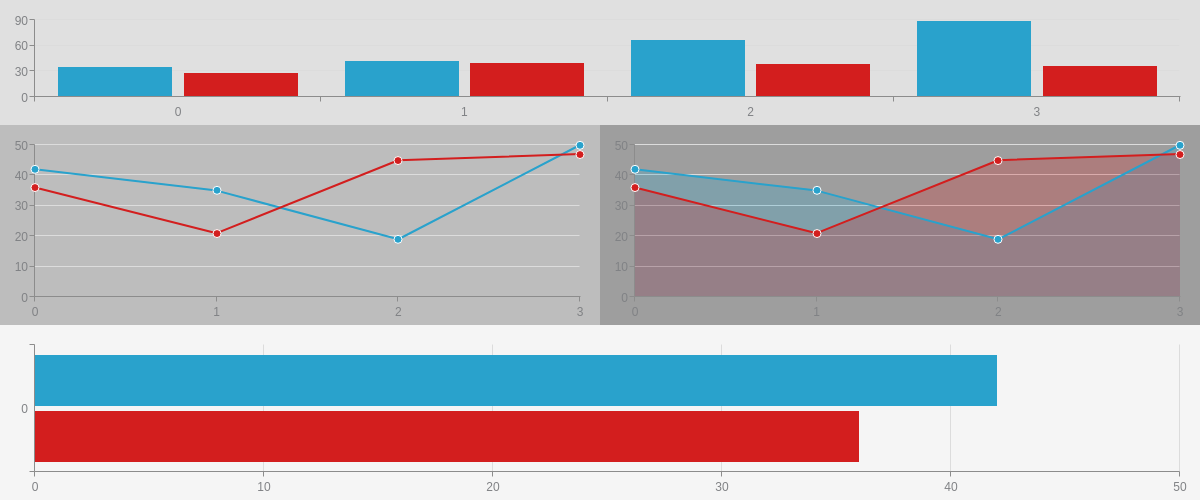
Demo 2
Advanced Dashboard Demo
ZingChart does support a media query-like syntax. We call this media rules. This feature allows you to define unique configurations at different screen sizes. It takes a little work but if used with graphset: [], you can create a fully responsive/adaptive dashboard which fully modifies the layout based on screen size.
Summary
A graphset can be used to place multiple charts within a single HTML container, using a single chart JSON. This allows you to create interactions between multiple charts, build dashboards, and more! For more information, see Adding Additional Charts.
For a full list of graphset attributes, see the JSON configuration page.