Widgets
Overview
Widgets are reusable chart containers that allow you to quickly duplicate a base chart with different features on the duplicated charts. A widget is responsible with the creation of a collection of 3 ZingChart elements: labels, shapes and graphs. Every inclusion of a widget in your chart JSON will inject the items created by the widget into the main JSON. This leads to a bigger JSON that the library understands and renders but offers modularity and code separation.
Using Widgets
Define a Widget
First, let's discuss how to define a widget. Widgets must be instantiated as a part of the ZingChart object. To create widget myWidget, you will have to start with the following:
zingchart.widgets.myWidget = {...};
Now, ZingChart will recognize the name of the widget when it is passed through your chart JSON.
Add Widget Behavior
Widgets can have any amount of functions, but should have the following 3 functions to set and update data: parse, info, and update.
Parse Function
The parse function is the only required function. As mentioned above, widgets must define a collection of three elements: graphs, labels, and shapes. This will be done through the parse function. Within your widget definition, add a parse function that returns an object with three arrays: graphs, labels, and shapes.
zingchart.widgets.myWidget = {
  // ...
  parse: function(data) {
    // ...
    return {
      labels: [...],
      shapes: [...],
      graphs: [...]
    }
  }
}
The data parameter here will take in all of the data supplied in your chart JSON.
Info Function
The info function allows you to set static information for the widget. For example, in a widget where you are getting and formatting the current date and time, you can format that within the info function and reference the data later, in the parse function.
info: function () {
  let date = new Date();
  let hr = date.getHours(), min = date.getMinutes(), mod = 'AM';
  if (hr > 12) {
    hr -= 12;
    mod = 'PM';
  }
  hr = (hr < 10) ? ('0' + hr) : hr;
  min = (min < 10) ? ('0' + min) : min;

  return {
    day: date.getDate() + ' ' + date.getMonth() + ' ' + date.getFullYear(),
    time: hr + ':' + min + '<span style=\'font-size:39px\'>' + mod + '</span>'
  };
},
parse: function () {
  let info = zingchart.widgets.myWidget.info();
}
Now, your static data is accessible in your parse function.
Add Widget to Primary Chart JSON
Let's skip ahead for a moment to discuss the ZingChart chart JSON. Typically, you would have a chart JSON similar to the following:
{
  type: 'bar', // or some other chart type
  // other configuration data
}
When using widgets, your chart JSON will look like this, instead:
{
  type: 'null',
  widgets: [
    {
      type: 'myWidget',
      // add data
    }
  ]
}
Any attribute you add to the widget here, for example if you added a height attribute, would be transmitted through the data parameter discussed above. See the following example;
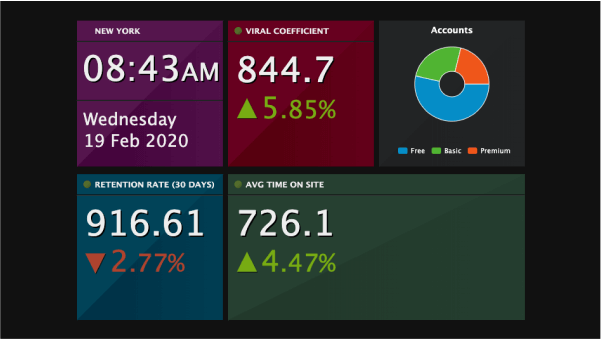
{
  // ...
  widgets: [
    {
      type: 'dashboard_datetime',
      id: 'dash1',
      backgroundColor1: '#55154D',
      backgroundColor2: '#44043C',
      title: 'NEW YORK',
      width: '230px',
      height: '230px',
      x: '10px',
      y: '13px',
    }
  ]
}
// .....
zingchart.widgets.dashboard_datetime = {
  // ...
  parse: function (data) {
    let x = parseInt(data.x) || 0;
    let y = parseInt(data.y) || 0;
    let w = parseInt(data.width) || 240;
    let h = parseInt(data.height) || 240;
    let id = data.id || 'dash';
    let title = data.title || '';
    let value = data.value || '';
    let percent = data.percent || 0;
    // ...
  }
}
Summary
Widgets are reusable chart components to allow you to encapsulate and reuse similar "base" charts. They are most useful when you have multiple charts in a graphset that are the same type.