Custom Modules
Overview
There are two different types of modules in ZingChart: chart type modules and plugin modules. Chart type modules are initialized by the value of the type attribute in the graph object. Plugin modules are initialized through the use of the modules option in the zingchart.render() method.
With each of these custom module types, the idea is similar: modify the original JSON, add event listeners, and define options for your custom module.
Define a module using the defineModule() method:
zingchart.defineModule(String name, String type, Function callback);
Parameters
| Parameter | Type | Values | Details |
|---|---|---|---|
| name | String | N/A | Required. User defined string to use as the name for the module. |
| type | String | "chart"|"plugin" | Required. Determines the type of the module. A module of type "chart" will be used when the value of a chart object's type attribute matches that of the module name. A module of type "plugin" will be used when there is an object within the chart JSON that matches the plugin name. |
| callback | Function | N/A | Required. User defined function that is used to manipulate the original chart JSON, define options, and add event listeners. This function receives the original chart JSON of the chart using the custom module. This function must return the modified version of the original chart object, or an entirely new object altogether. |
Note: Module definitions can be placed within your HTML page, or in a separate zingchart-[MODULE NAME].min.js file.
Defining a Chart Type Module
To define a module that will serve as a standalone chart type, set the defineModule type parameter to chart. Be sure to pass a single argument to your function. This argument will allow you to gain access to the chart configuration object that makes use of your custom module.
Example
/**
 * Perform JSON manipulation on the originalJson object, define options,
 * and add event listeners here.
 */
zingchart.defineModule('hello-world', "chart", function (originalJson) {
  return originalJson; // Modified version of originalJson
});
When defined in this way, any chart object that uses the module name as the value for the type attribute will apply this module's logic.
zingchart.render({
  id: 'myChart',
  height: 400,
  width: 600,
  data: {
    type: 'hello-world'
  }
});
View all of the options on the Defining Chart Type Module Options page.
Defining a Plugin Module
To define a module that will serve as a plugin, set the defineModule type parameter to plugin. Be sure to pass a single argument to your function. This argument will allow you to gain access to the chart configuration object that makes use of your custom module.
Example
/**
 * Perform JSON manipulation on the originalJson object, define options,
 * and add event listeners here.
 */
zingchart.defineModule('hello-world', "plugin", function (originalJson){
  return originalJson; // Modified version of originalJson
});
Plugin modules must be explicitly loaded using the modules option in the render method. When defined in this way, any chart that contains an object of the plugin name will apply this module's logic.
zingchart.render({
  id: 'myChart',
  height: 400,
  width: 600,
  modules: 'hello-world', // Load the module
  data: {
    type: 'bar',
    'hello-world': {}
  }
});
JSON Manipulation
For both chart type modules and plugin modules, JSON manipulation is handled the same way. In the example below, originalJson is the chart object containing a chart with the matching type attribute (since this is a chart type module). If this were a plugin module, originalJson would be the chart object containing the hello-world object in the top level of the chart JSON. Perform your JSON manipulation on the originalJson object, taking the steps necessary to prevent data obliteration!
Chart Type Example
zingchart.defineModule('hello-world', "chart", function (originalJson) {
  /* Create our hello world label */
  var helloWorldLabel = {
    text: "Hello, world!",
    id: "label1",
    height: "60%",
    width: "80%",
    x: "10%",
    y: "20%"
  };
  /*
   * The ?: ternary operation is used here to check for existing labels in the originalJson object.
   * If a labels array exists, the label is pushed into it,
   * otherwise, it is placed into a new array.
   */
  originalJson[ "labels" ] ?
    originalJson[ "labels" ].push(helloWorldLabel) :
    originalJson[ "labels" ] = [helloWorldLabel];

  return originalJson;
});
If you are using a graphset array with multiple chart objects, the defineModule method will automatically loop over each object in the array, applying your module's logic to only the chart objects that use the custom module.
Defining Chart Type Module Options
While you can define options in a number of ways, we recommend placing options for a chart type module in an options object at the graph level. For example,
{
  type: 'hello-world',
  options: {
    universe: true
  }
}
Now to define our boolean universe attribute in our chart type module definition:
zingchart.defineModule('hello-world', "chart", function (originalJson) {
  /* Previously shown code omitted for brevity */

  /* Check for the existence of the options object */
  if (originalJson[ "options" ]) {

    /* It exists! Instantiate oOptions as the object containing our custom options. */
    var optionsObj = originalJson[ "options" ];

    /* Check for universe: true, find our label and modify it if true */
    if (optionsObj[ "universe" ]) {
      for (var n = 0; n < originalJson[ "labels" ].length; n++) {
        if (originalJson[ "labels" ][n][ "id" ] == "label1") {
          originalJson[ "labels" ][n] = "Hello, UNIVERSE!";
        }
      }
    }
  }
  return originalJson;
});
Defining Plugin Module Options
For a plugin module, check the plugin object for options, instead of checking for an options object:
zingchart.defineModule('hello-world', "plugin", function (originalJson) {
  /* Previously shown code omitted for brevity */

  /* Instantiate oOptions as the plugin object */
  var optionsObj = originalJson[ 'hello-world' ];

  /* Check for universe: true, find our label and modify it if true */
  if (optionsObj[ "universe" ]) {
    for (var n = 0; n < originalJson[ "labels" ].length; n++) {
      if (originalJson[ "labels" ][n][ "id" ] == "label1") {
        originalJson[ "labels" ][n] = "Hello, UNIVERSE!";
      }
    }
  }
  return originalJson;
});
Adding Event Listeners
If you want to make your module interactive, event listeners are a must. For example, if you added shape objects for some kind of toolbar during the JSON manipulation phase, you'll need to set up event listeners to allow the user to interact with your toolbar. Here, we add a label_click event listener to our module:
zingchart.defineModule('hello-world', "chart", function (originalJson) {
  /* Previously shown code omitted for brevity */

  zingchart.bind(null, 'label_click', function (chartObj) {
    if (chartObj.graphid == "helloworld0") {
      console.log('What? What do you want?');
    }
  });
  return originalJson;
});
Notice that comparison between chartObj's graphid value and helloworld0? The defineModule() method generates an ID for a chart type module, using the name of the module itself (with hyphens removed) and the index of the chart object in the graphset. So, if you have a module called my-first-module at index 0 in your graphset (or it's just a lone chart object not in a graphset), defineModule() will generate and apply an ID called myfirstmodule0. You can use this to increase event specificity in your charts, as we have done above.
Minifying Your Script
We recommend using UglifyJS for the minification of the library.
To use as a command line app, install using NPM:
npm install uglify-js -g
Then define the UglifyJS options in the command line as follows:
uglifyjs [input file] [options]
If the defineModule code is placed in a standalone file instead of directly in the HTML document, you may output the minified source to a separate file (UglifyJS defaults to STDOUT):
uglifyjs zingchart-hello-world.js --compress --output zingchart-hello-world.min.js
View further details of UglifyJS on GitHub.
Examples
The following two demos may look identical on the surface, but if you dive into the code used to create each one of these custom modules, you'll soon discover the difference between the two.
Custom Chart Type Module
Custom Plugin Module

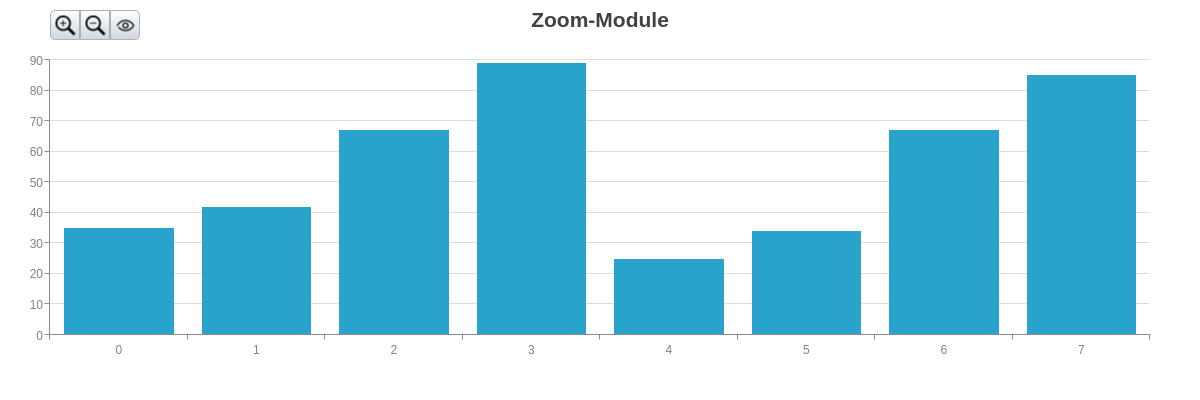
Custom Zoom Module
GitHub Examples
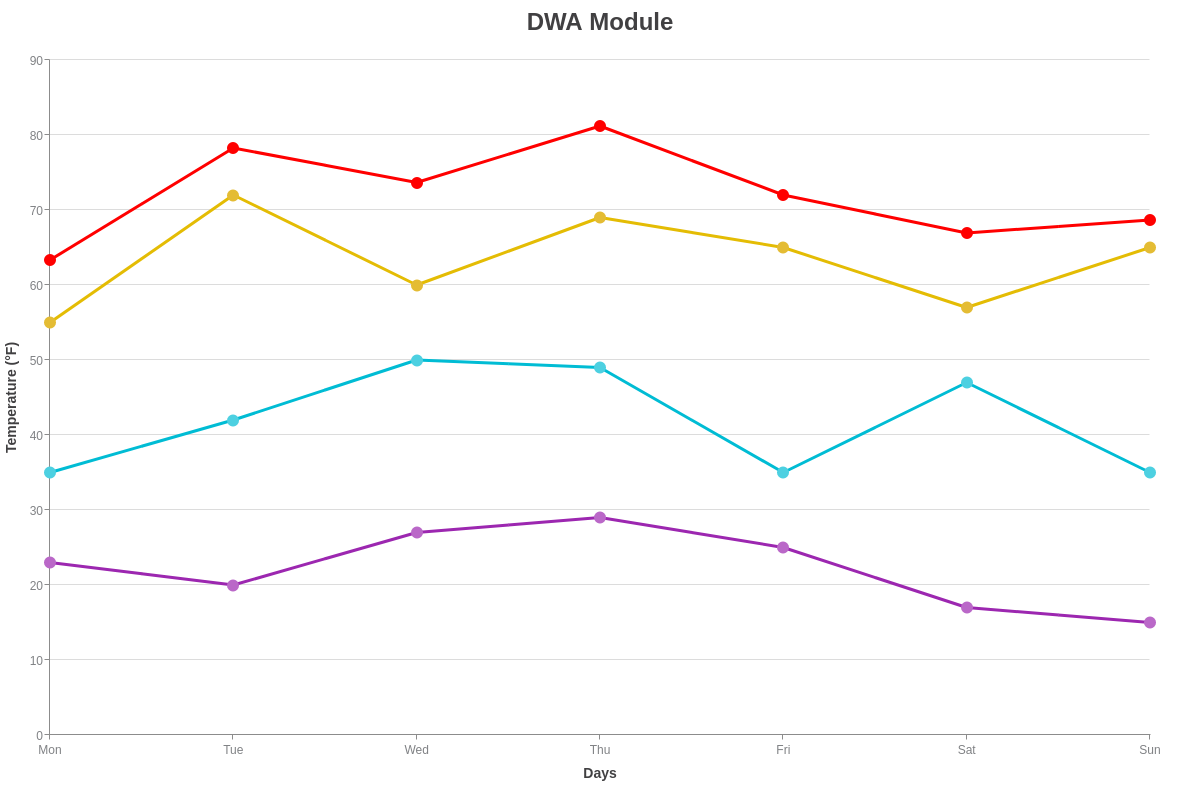
We also have a full example of a Distributed Weighted Average module for you to use as a reference guide for writing custom modules. You can see the code and a usage guide on our GitHub.
Summary
Custom modules allow you to create and reuse your own ZingChart chart types and features. See our list of ZingChart modules before building your own - we might already have it!