Vector Plot Charts
Note: See our Vector Plot Gallery for inspiration on all the different vector plot possibilities.
Vector Chart Type and Options
ZingChart vector plots use the type attribute and the options object. In your chart object, add a type attribute and set the value to vectorplot. Next, create an options object. Use the options object to configure the vector plot data.
{
   type: "vectorplot",
   options: {}
Data
Vector plot charts use data added via a data array inside of the options object. Each sub-array in the data array represents a vector that will be drawn on the chart. It is formatted in the following way: [xPosition, yPosition, length, angle].
{
   type: "vectorplot",
   "options": {
       "data": [
            [5, 5, 190, 18],
            [5, 10, 185, 27],
            [5, 15, 180, 36],
       ]
    }
}
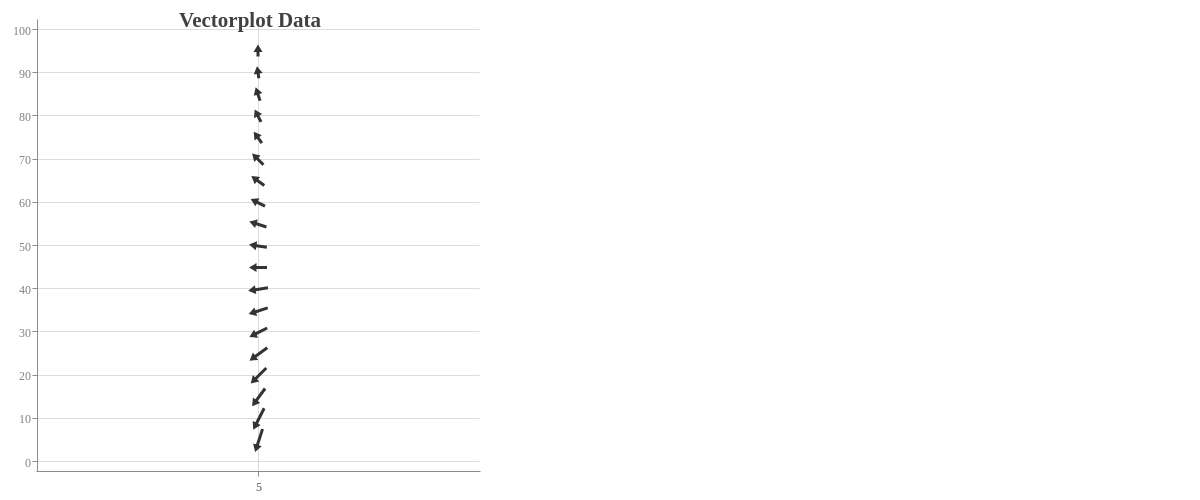
Chart-Specific Properties
Use the options object to configure the vector plot and its arrows.
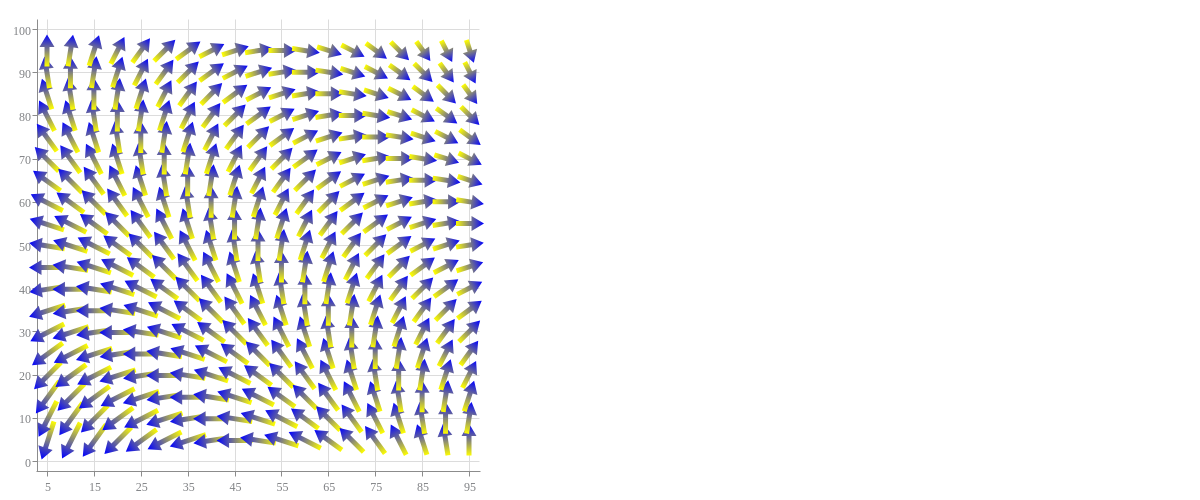
Arrow
The arrow object allows you to control the minimum and maximum length and the style of the arrows. To style the arrows, use a style object and the appropriate attributes, such as size and backgroundColor.
{
   type: "vectorplot",
   options: {
       arrow: {
            minLength: 12,
            maxLength: 20,
            style: {
                size: 5,
                backgroundColor: "yellow blue"
            }
        },
    }
}
Further Customization
Configure your vector plot chart's appearance through value boxes, tooltips, and a legend.
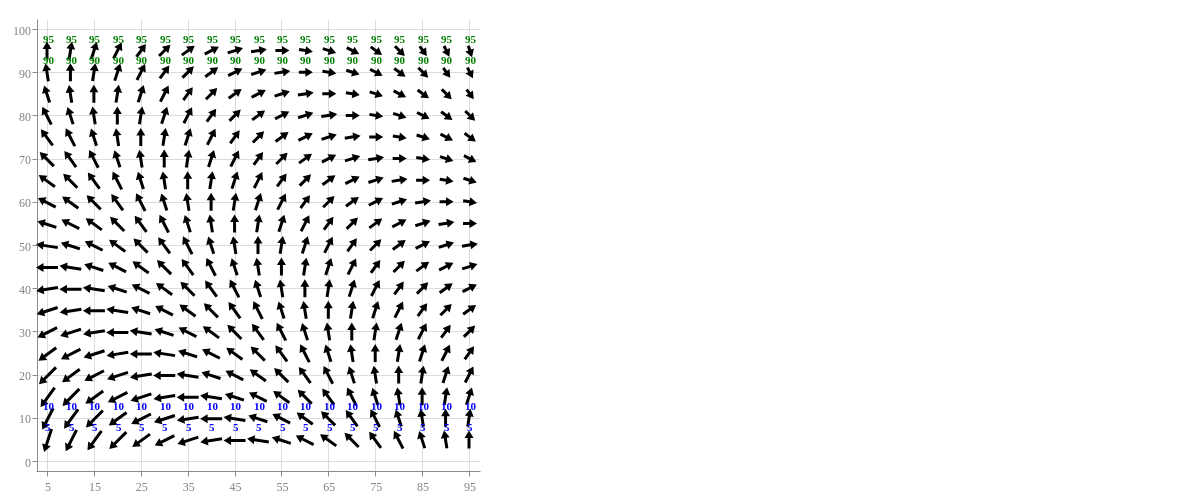
Value Boxes
Value boxes are not visible on vector plot charts by default. To include them in your chart, add a valueBox object to your plot object. You can style and format them, as well as incorporate rules to force certain value boxes to show under certain conditions (e.g., to highlight outliers, notable data points, or minimum/maximum values).
Note: Learn more about value boxes with our Value Boxes Tutorial. For a list of available attributes, see our Value Boxes JSON Attributes/Syntax page.
In the example chart below, rules were used to display values greater than or equal to 90 and less than or equal to 10.
Note: Read more on rules and tokens in our Logic Rules and JavaScript Tokens tutorials.
{
    plot: {
      valueBox: {
        rules: [
          {
            rule: "%v >= 90",
            fontColor: "green"
          },
          {
            rule: "%v >10 && %v < 90",
            visible: false
          },
          {
            rule: "%v <= 10",
            fontColor: "blue"
          }
        ]
      }
    },
}
Tooltips
Tooltips appear when you hover over a data point on your vector plot chart. To customize and style them, add a tooltip object to your chart object. You can turn their visibility on or off with a visible attribute. Set the value to true (default) or false.
Specify what text appears with a text attribute. Place your desired text inside a string. ZingChart tokens, such as %v (scale value) and %t (plot text), can be used here. Style your tooltips (font, background, borders) with attributes such as fontColor, fontFamily, backgroundColor, borderColor, borderWidth, and more.
Note: Learn more about tooltips with our Tooltips Tutorial. For more tooltip styling options, see our Tooltips JSON Attributes/Syntax page.
{
    tooltip: {
      text: "Arrow number %i: %v",
      fontColor: "black",
      fontFamily: "Georgia, serif",
      backgroundColor: "white",
      borderColor: "black",
      borderWidth: 2
    },
}
Legend
To include a legend on your chart, place a legend object in your chart object. You can include attributes to specify your legend's layout, positioning, styling, headers/footers, and more.
{
  type: "vectorplot",
  legend: {}
}
Note: Learn more about legends with our Legends Tutorial and Legends JSON Attributes/Syntax page.