Rules
Create conditional formatting with JavaScript JSON configuration to style your chart with the rules attribute.
Overview
Rules allow you to include logic in order to change or modify the appearance of your chart based on specified criteria or "rules".
Within rules, you can use logical operators (||, && and !=) along with comparison operators (==, >, <, >= and <=).
You can also use arithmetic operators within rules: +, -, *, / and %.
Numeric
You can use all numeric values with all operators from the above types.
rules: [
    {
        rule: '%kv == 5',
        backgroundColor: 'green'
    }
]
String
You can use string values with all operators from the above types, but you must define quotes around the values.
rules: [
    {
        rule: '"%kl" == "Tue"',
        backgroundColor: 'red'
    },
    {
        rule: '"%kt" == "Wed"',
        backgroundColor: 'red'
    },
    {
        rule: '"%kv" == "4"',
        backgroundColor: 'red'
    }
]
Basics
The first step to using rules is to create the "rules" container. This is where you will define your rules.
rules: [ ]
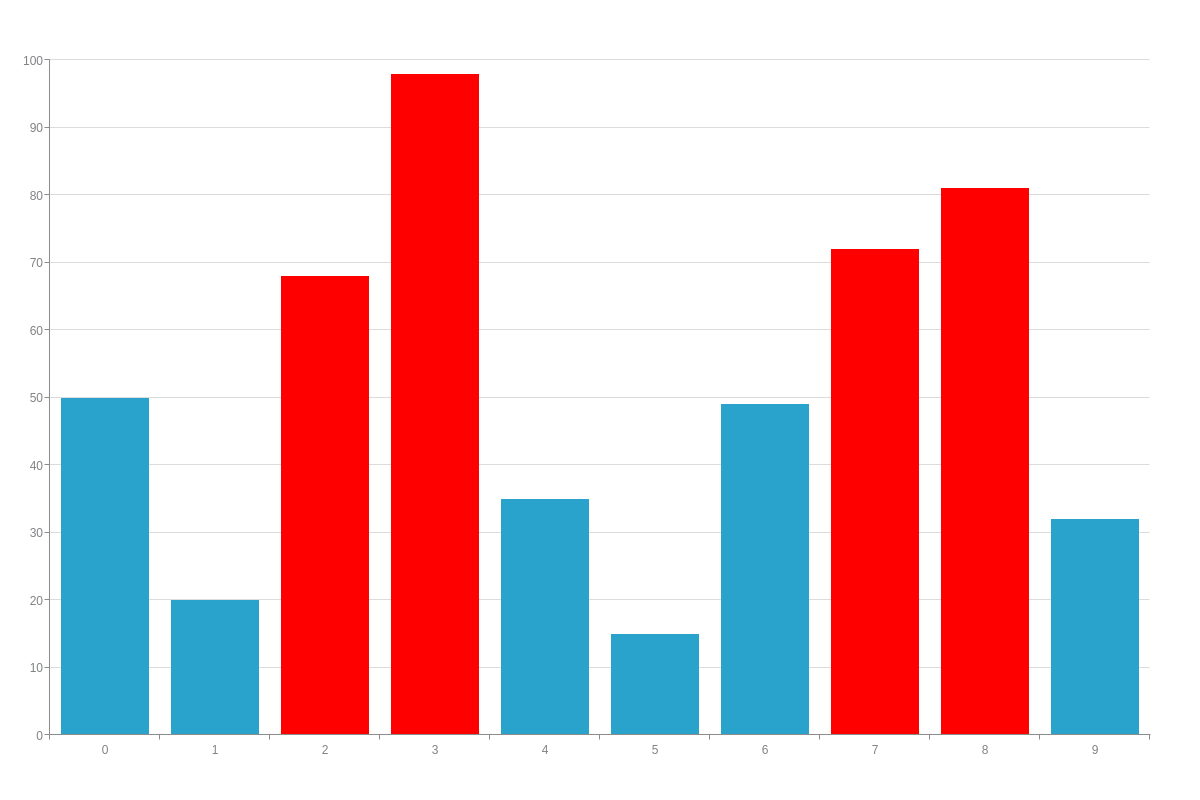
Inside of the "rules" container, you can open a rule set. You can include as many rule sets within the container as you would like. Then, add your "rule" attribute along with the criteria you want to check for. For example, the following rule checks if the plot value is greater than 50 using the %v token.
For a complete list of tokens that you can use in your rules, check out the Tokens article.
rules: [
    {
        rule: "%v > 50"
    }
]
The next step is to specify what you would like the chart to do if that rule is met. You can place the attributes you would like to change right after the rule. For example, if you wanted to change the background color to red if the value is greater than 50, you could do the following:
rules: [
    {
        rule: "%v > 50",
        'background-color': "red"
    }
]
It is important to remember that the "rules" object is not a stand-alone object. Rules are to be used within an object on your chart to change the appearance based on a met criteria. For example, if you have a bar chart and you want to change the color of the bars if they are over a certain value, you can place a "rules" object within the "plot" object.
plot: {
    rules: [
        {
            rule: "%v > 50",
            'background-color': "red"
        }
    ]
}
Styling
Backgrounds
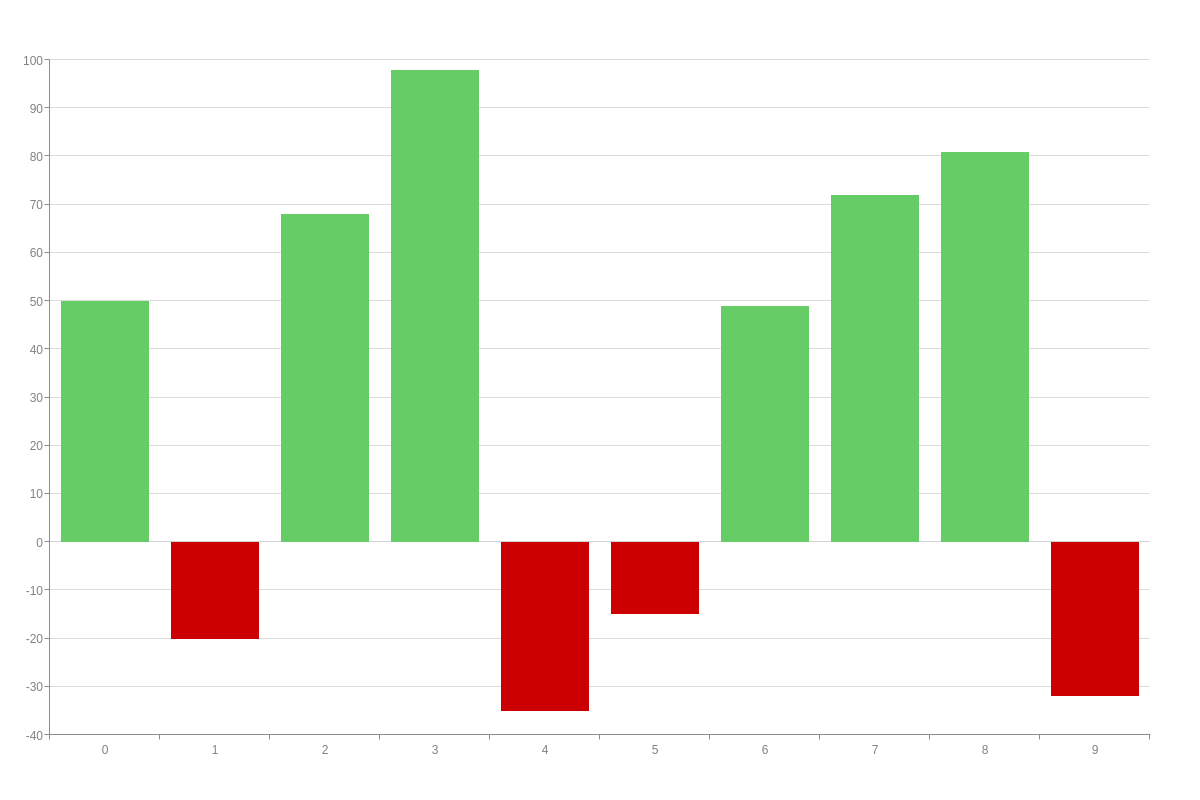
You've already seen how to change the bar color if the value is over a certain amount. Now, let's look at how you can use multiple rules to change the background color.
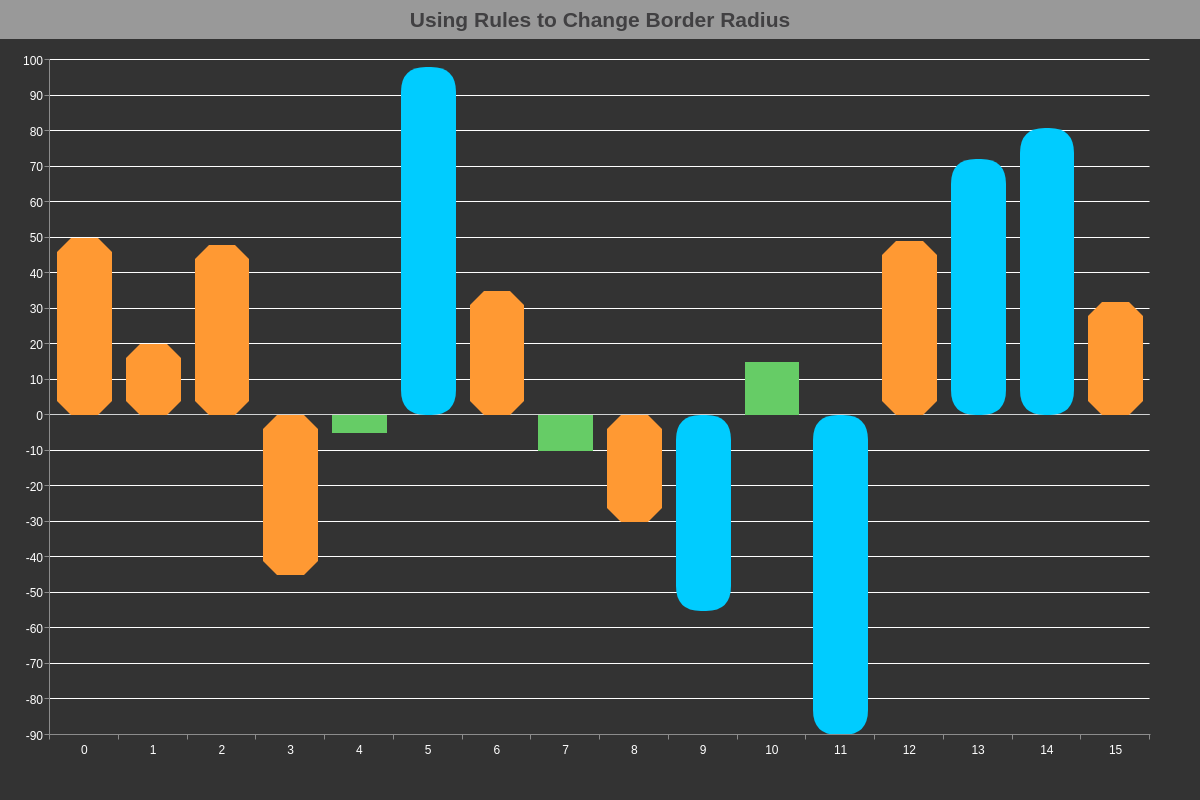
In this example, we are going to use multiple rules to change the background color to green if the value is above 0, and change the background color to red if it is below 0:
plot: {
    rules: [
        {
            rule: "%v > 0",
            'background-color': "#6c6"
        },
        {
            rule: "%v < 0",
            'background-color': "#c00"
        }
    ]
}
Now, what if you have a line chart and want the background color of the markers to be red if they are below a certain value? You can achieve this by placing the rules within a "marker" object. By doing this, you make your chart more clear and also easier to see things that may require more attention.
type: "line",
plot: {
    marker: {
        rules: [
            {
                rule: "%v < 25",
                'background-color': "red"
            }
        ]
    }
}
Lines
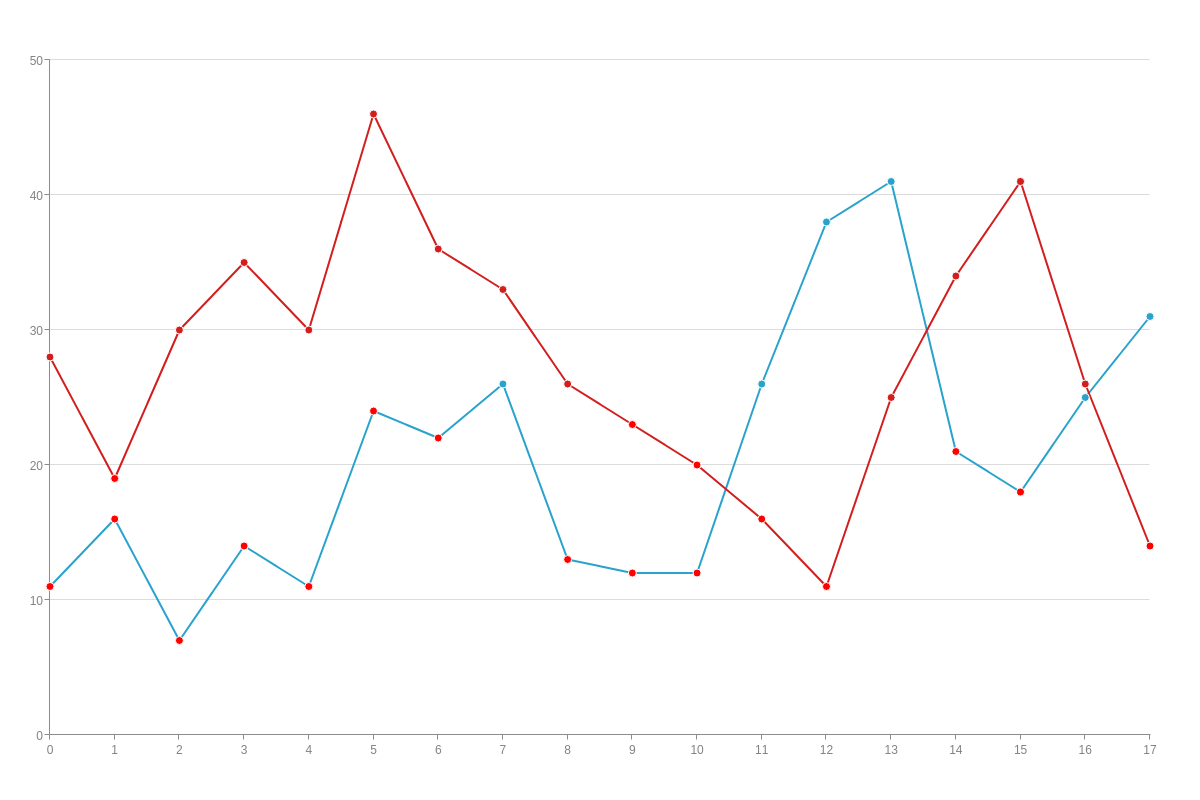
For charts that contain lines, you can style them based on criteria that you specify.
Remember, you're not limited to only using %v in your rules. You can use any of the available tokens. In this example, we used the %p token, or %plot-index, and styled the line for the plot index that is equal to 1.
type: "line",
plot: {
    rules: [
        {
            rule: "%p == 1",
            'line-color': "blue"
        }
    ]
}
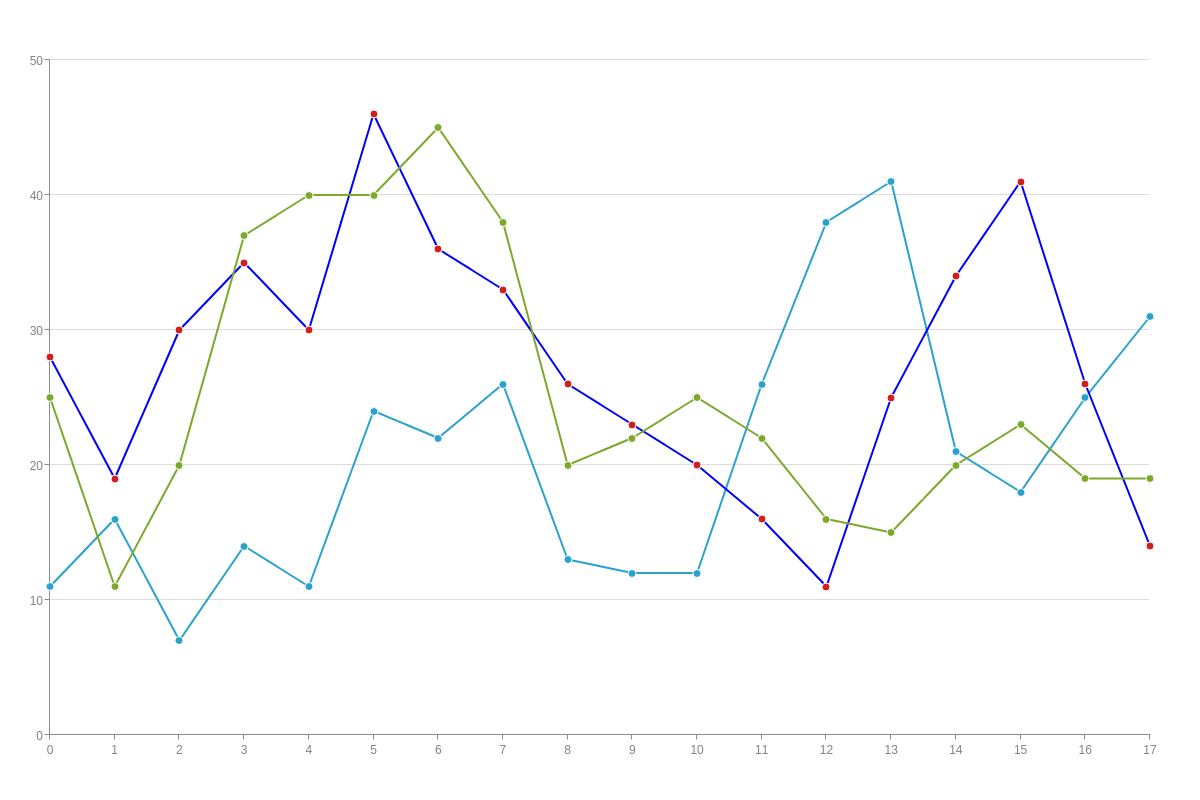
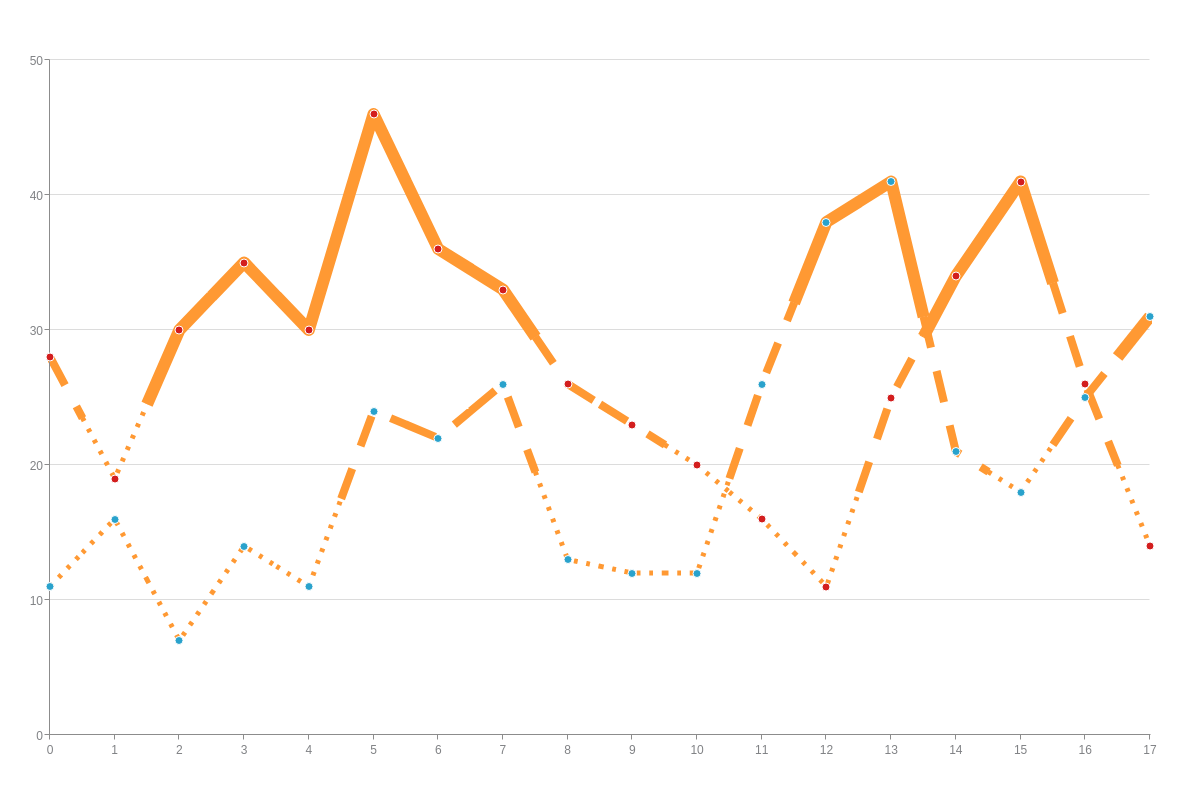
You can also change multiple attributes at the same time. In this example, within each rule set, we've set the "line-width", "line-color", and "line-style" based on its value.
type: "line",
plot: {
    rules: [
        {
            rule: "%v  20 && %v < 30",
            'line-color': "#f93",
            'line-width': "8",
            'line-style': "dashed"
        },
        {
            rule: "%v >= 30",
            'line-color': "#f93",
            'line-width': "12",
            'line-style': "solid"
        }
    ]
}
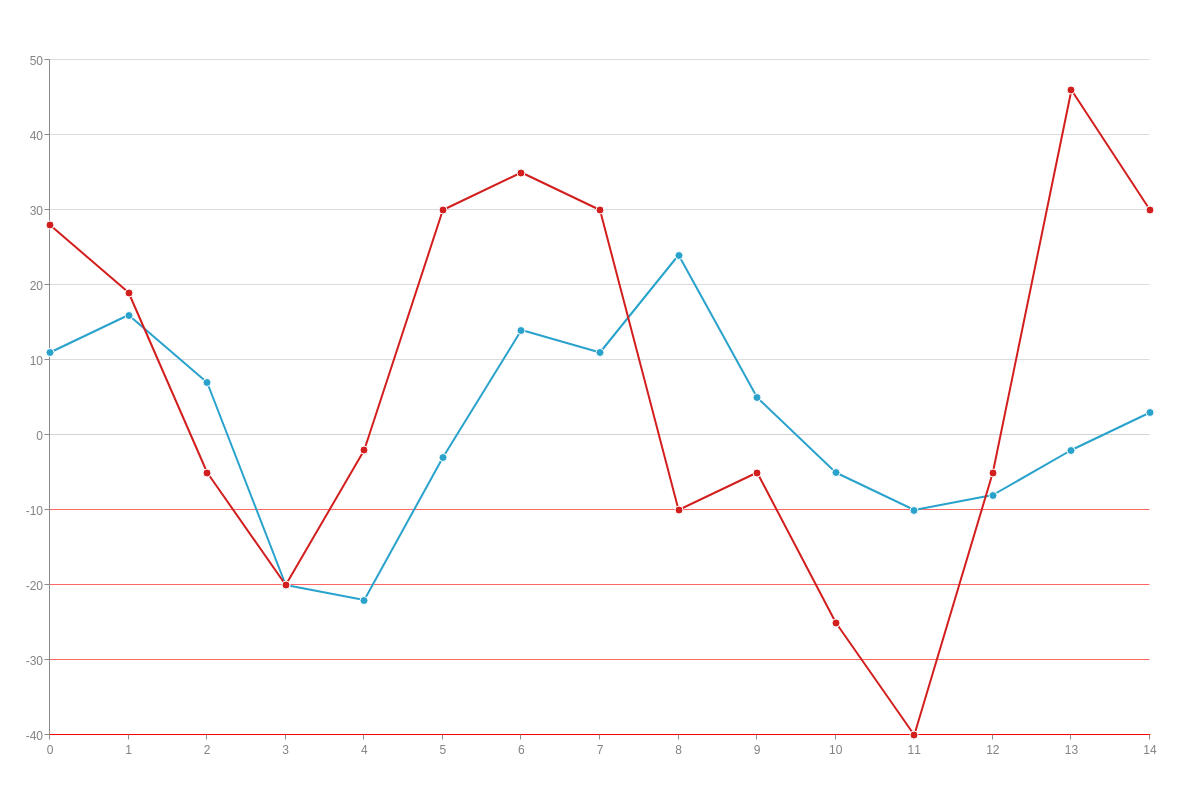
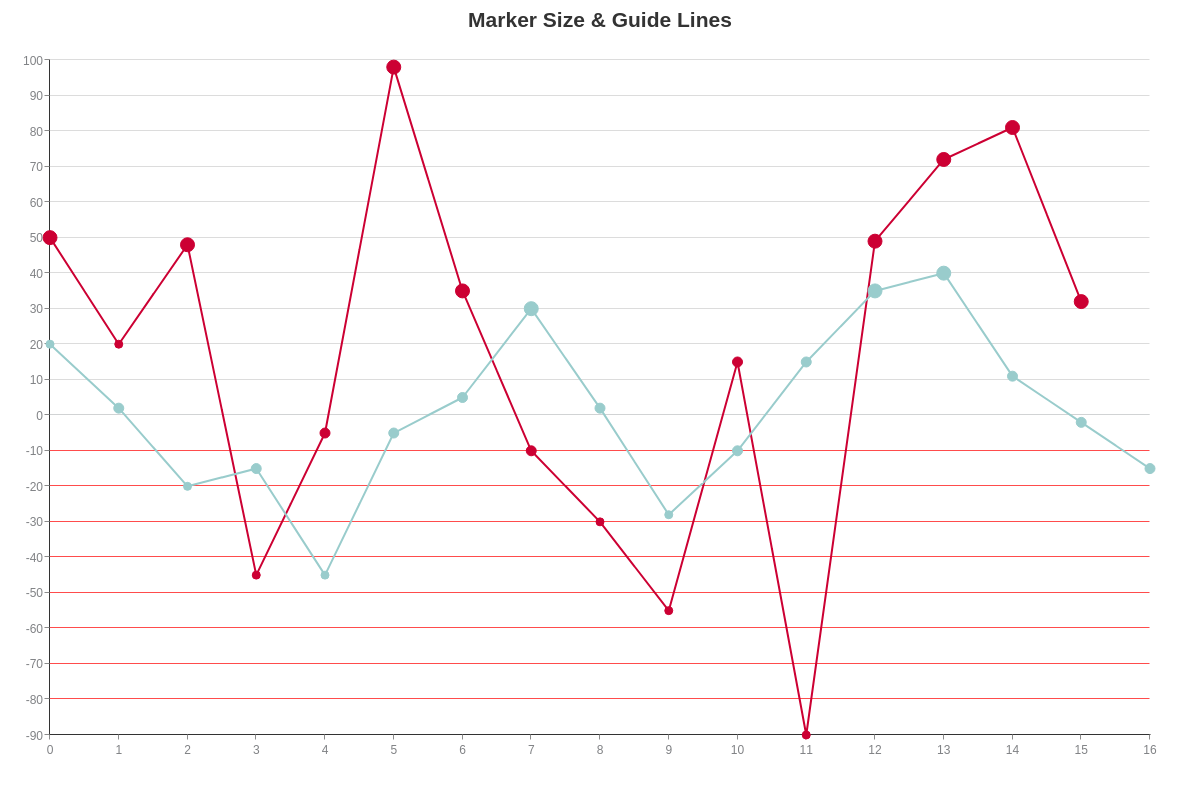
This isn't just limited to the plot lines. Let's look at how we can style our guidelines based on rules by making the "scale-y" guides red if they are a negative value.
type: "line",
'scale-y': {
    guide: {
        rules: [
            {
                rule: "%v < 0",
                'line-color': "red",
                alpha: "0.6"
            }
        ]
    }
}
Value Boxes
You can also use rules to display or style value boxes on your chart.
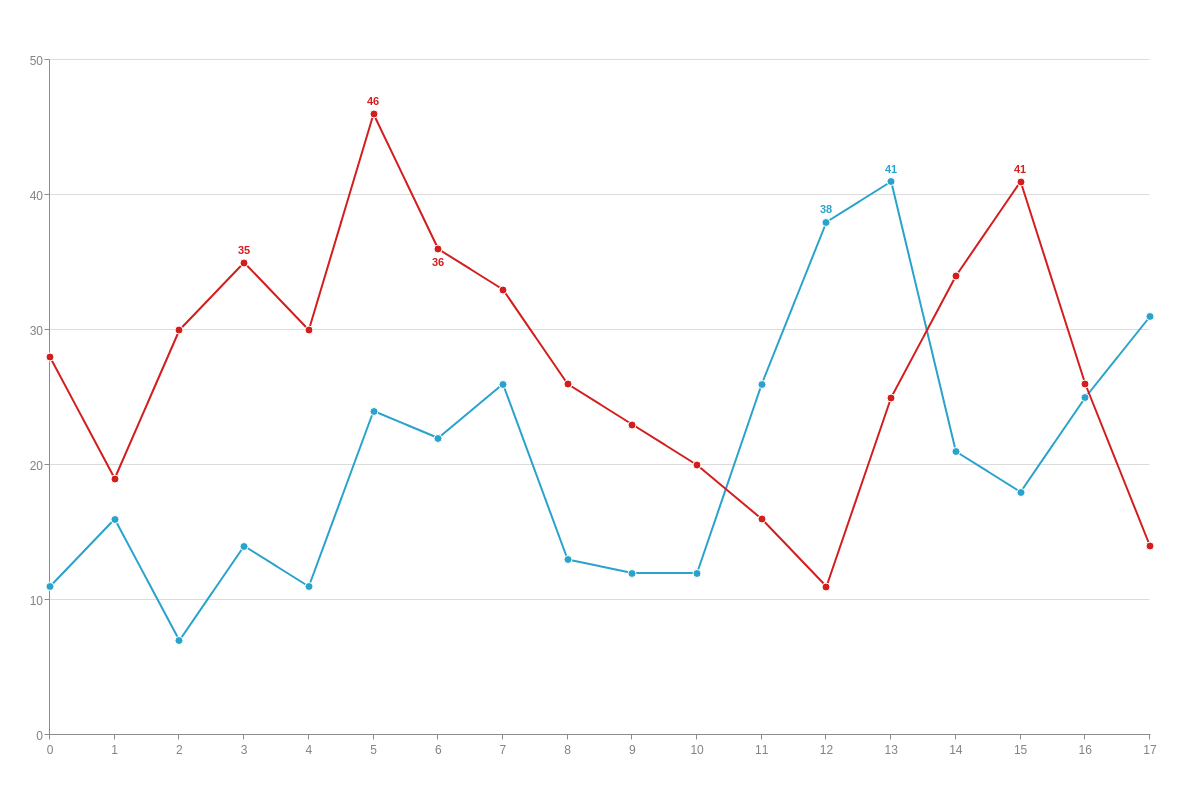
In the same way you changed the color based on our values, you can decide whether the value box will be visible or not based on the same values. In this example, we've hidden all of the value boxes that are below certain values.
type: "line",
plot: {
    'value-box': {
        rules: [
            {
                rule: "%v < 35",
                visible: "false"
            }
        ]
    }
}
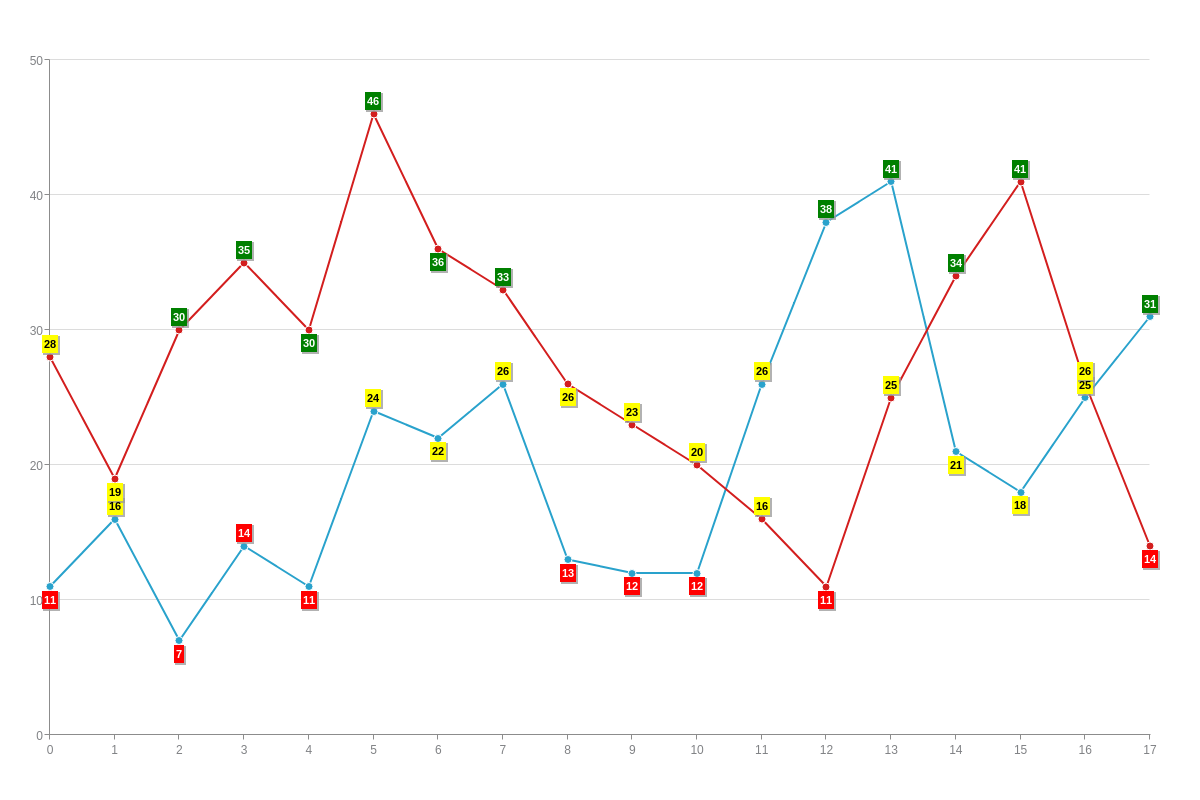
Just like we changed the color of markers that were below a certain value, we can instead, add color to our value boxes to indicate performance or importance.
type: "line",
plot: {
    'value-box': {
        rules: [
            {
                rule: "%v < 15",
                'background-color': "red",
                'font-color': "white"
            },
            {
                rule: "%v >= 15 && %v < 30",
                'background-color': "yellow",
                'font-color': "black"
            },
            {
                rule: "%v >= 30",
                'background-color': "green",
                'font-color': "white"
            }
        ]
    }
}
Borders
Next, let's look at a couple ways we can add and style borders using rules.
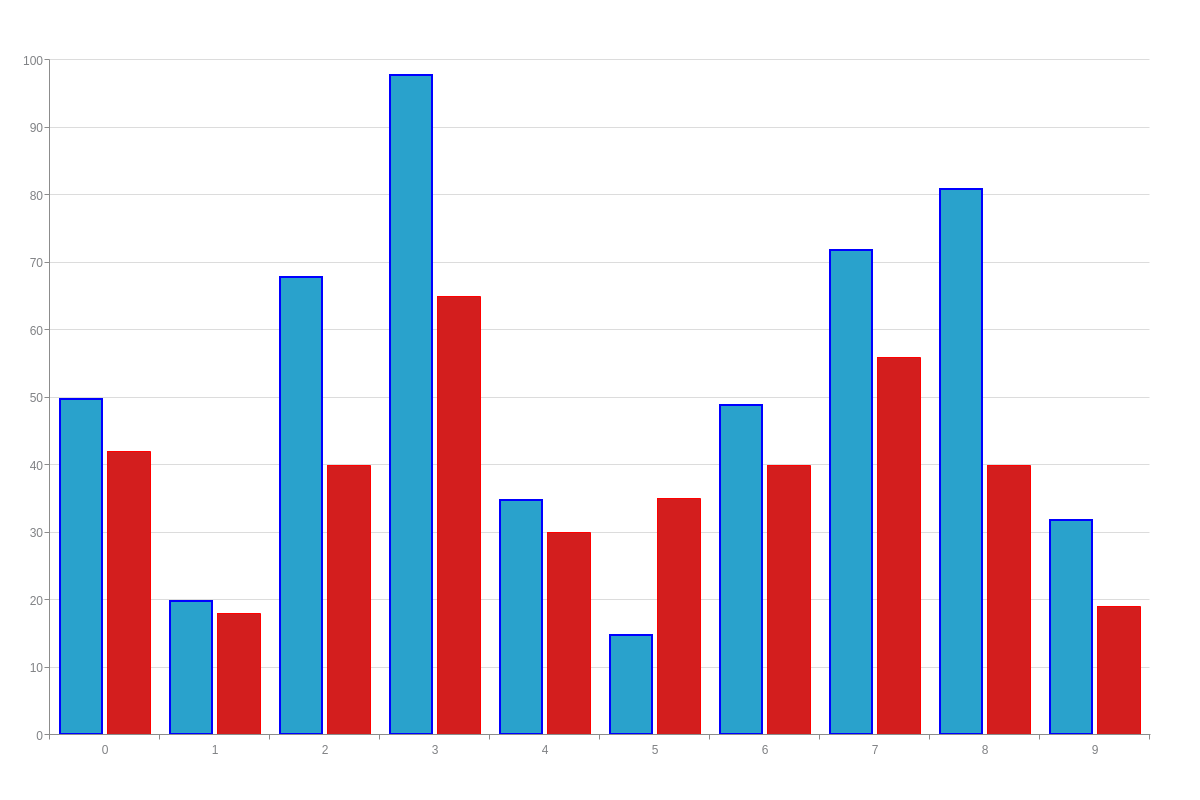
The next example uses the %pavg, or %plot-average, token to add either a red or blue border. If the plot's average is above 50, it will add a blue border. If it is below 50, it will add a red border.
This is a good example of where rules can come in handy, especially if you have multiple plots. Rather than having to figure out the average of each plot and then styling each one individually, ZingChart can do it for you.
type: 'bar',
plot: {
    rules: [
        {
            rule: "%pavg > 50",
            'border-width': "2px",
            'border-color': "blue"
        },
        {
            rule: "%pavg = 40",
                padding: "5px",
                'border-width': "3px",
                'border-color': "#366"
            },
            {
                rule: "%v < 40",
                padding: "4px",
                'border-width': "1px",
                'border-color': "#396"
            },
            {
                rule: "%v > 70"
            }
        ]
    }
}
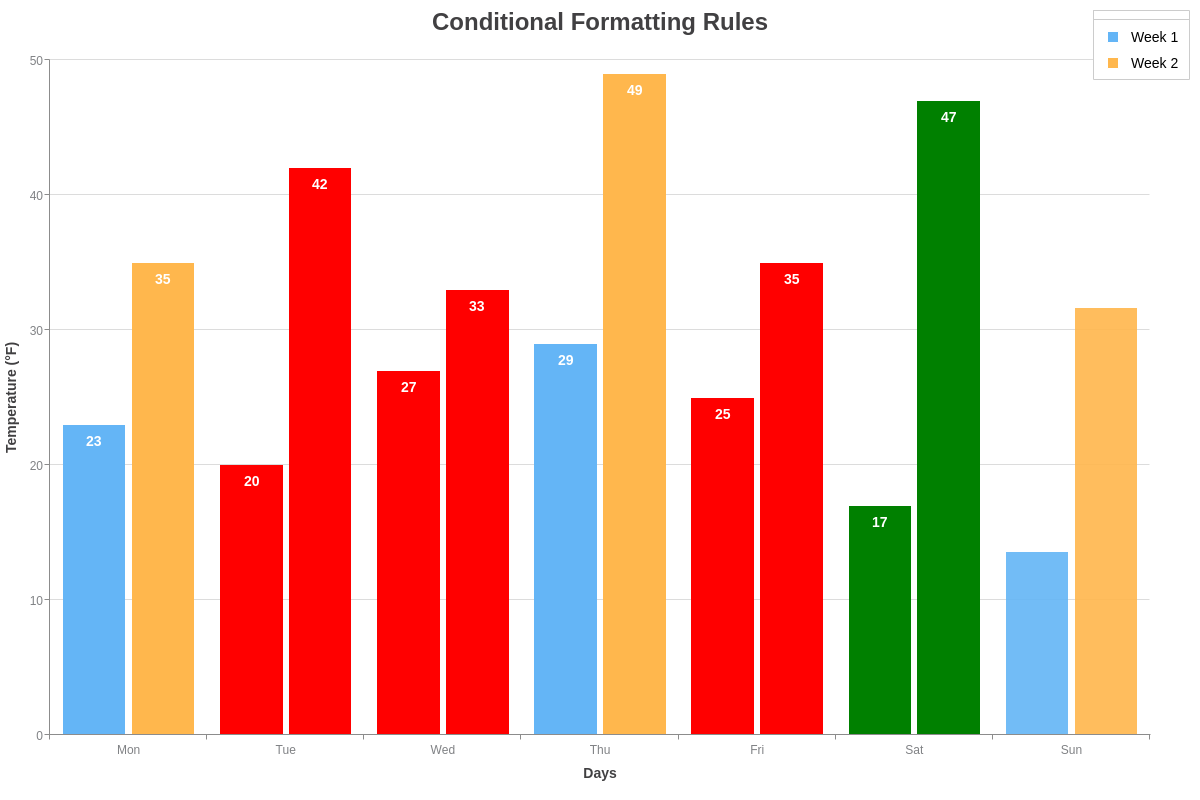
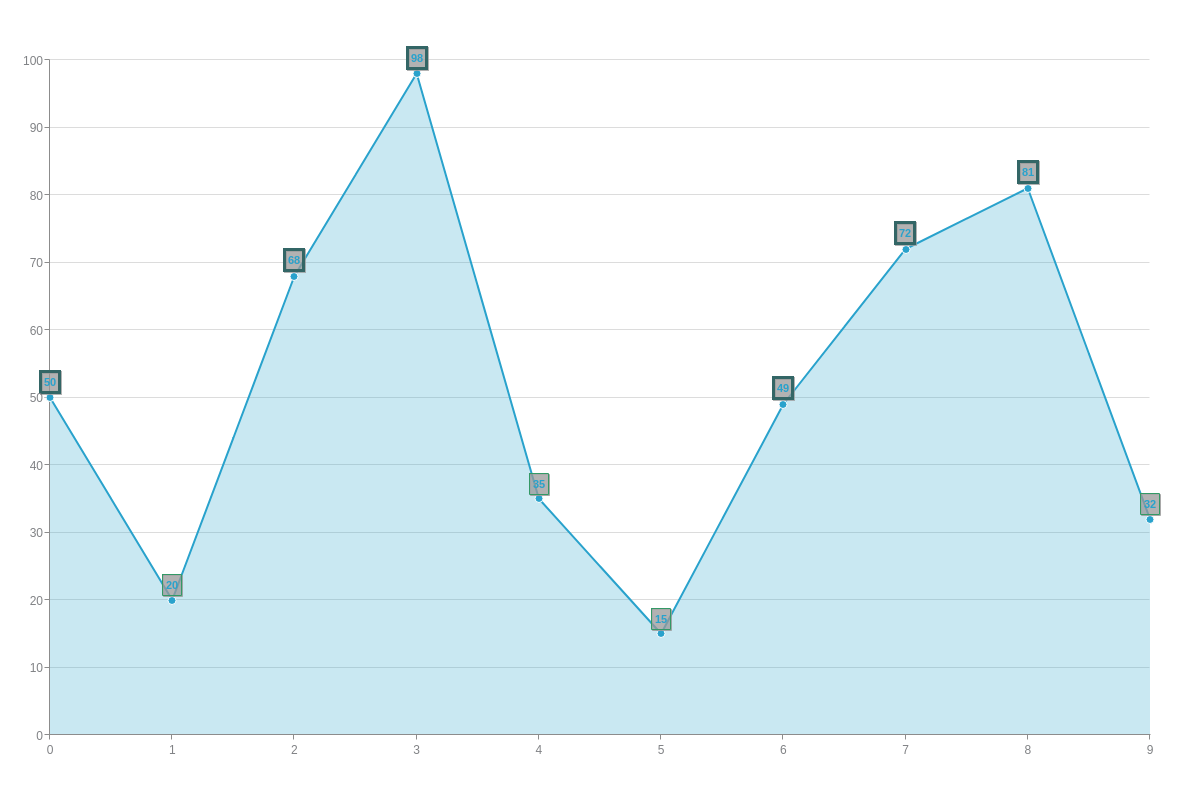
You can also change the borders of your value boxes based on our criteria.
Examples
Here are a couple more examples to help inspire you.
Summary
Rules allow you to set conditional formatting in your chart. This was just a brief look at what you can do with rules. For more information on how to use tokens and which tokens are available to you, check out the Tokens article.
Don't forget, a comprehensive list of available attributes and objects can be found on our JSON Syntax page.