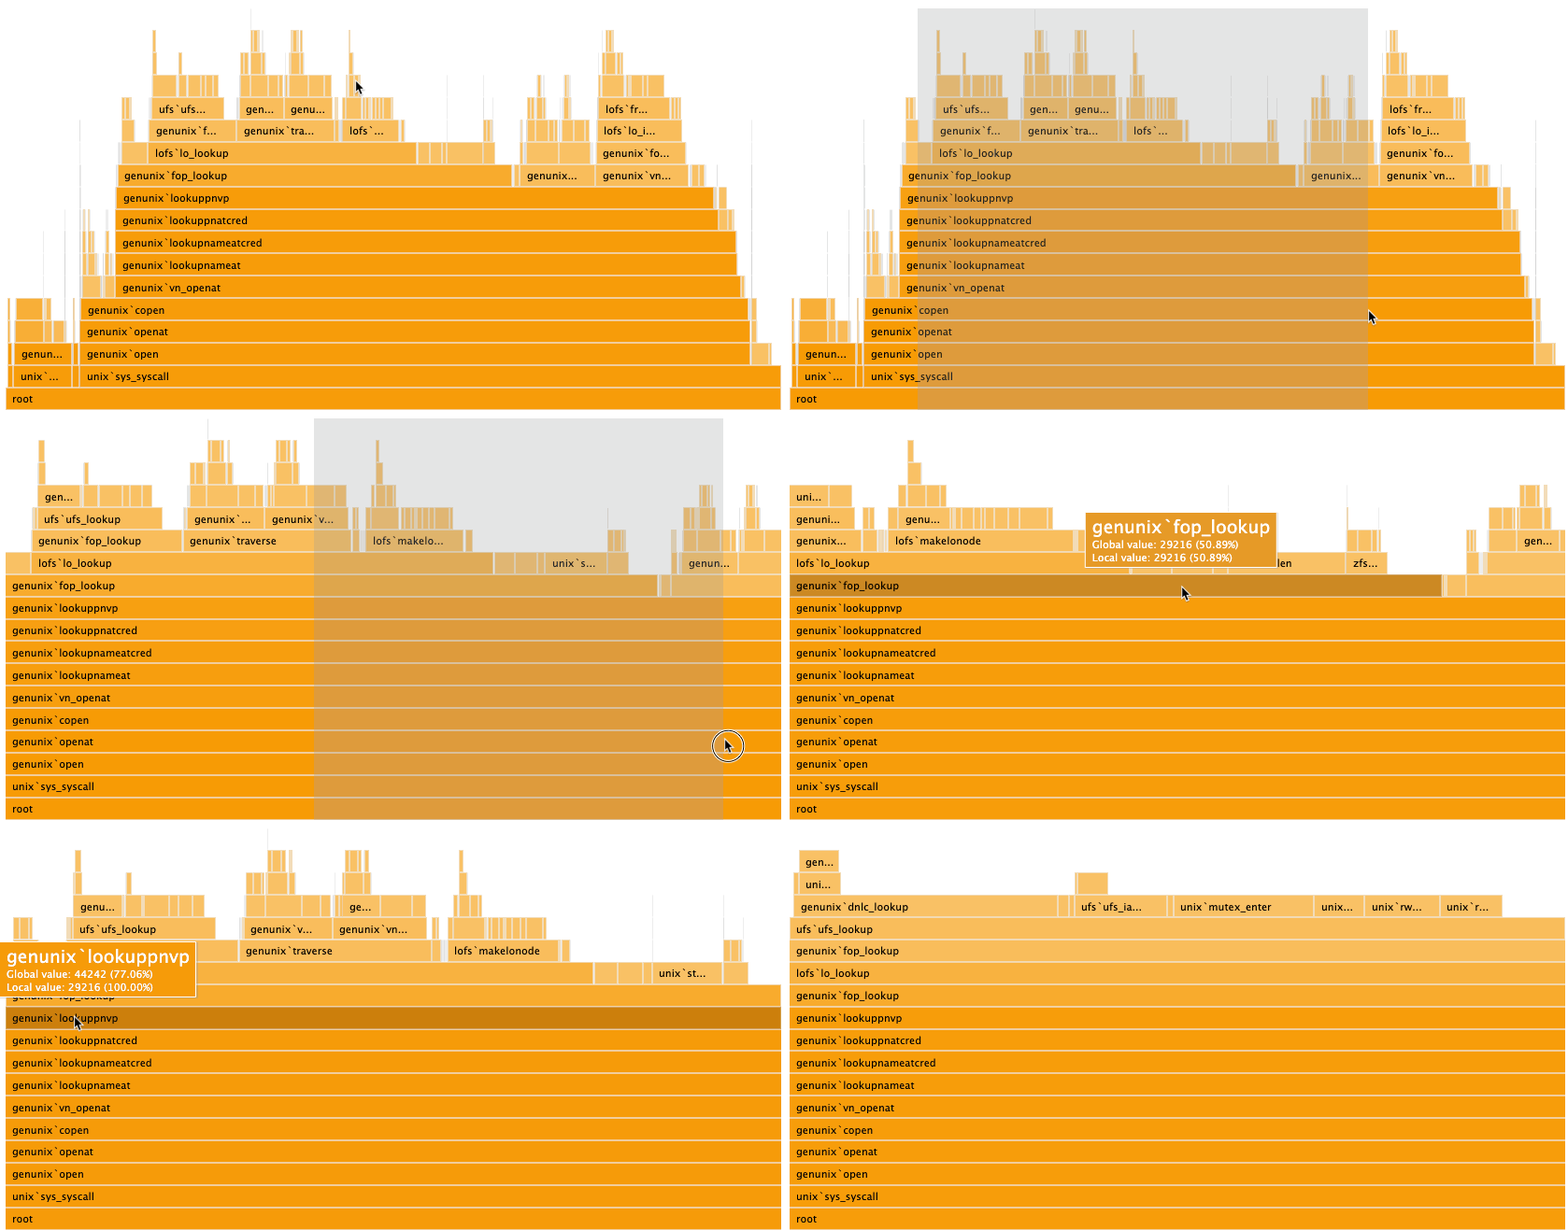
Flame Chart
Type
ZingChart flame charts use the type attribute. In your chart object, add a type attribute and set the value to flame.
{
	type: 'flame'
}
Actions
There are some default user interactions you should know about flame charts.
Click
You can click on the chart to zoom in on any piece of the bar.
Click + Drag
You can click and drag to zoom in on the chart. You can click on a bar to zoom out.

Data
To enter data into the flame chart, use the series array. Each object in the series array requires a name, value, or children array to function properly.
Note: Learn more about the series array with our series JSON Configuration page.
{
  "children": [
    {
      "name": "genunix`syscall_mstate",
      "value": 89
    },
    {
      "children": [
        {
          "name": "genunix`gethrtime_unscaled",
          "value": 4
        },
			]
		}
  ]
}
Further Customization
You can also use the options object to style your chart.
Palette
The palette attribute defines a custom palette for your flame chart. Provide a string of comma separated color, HEX, or RGB values.
{
  options: {
    palette: ['#ff9900']
  }
}