Tree Charts
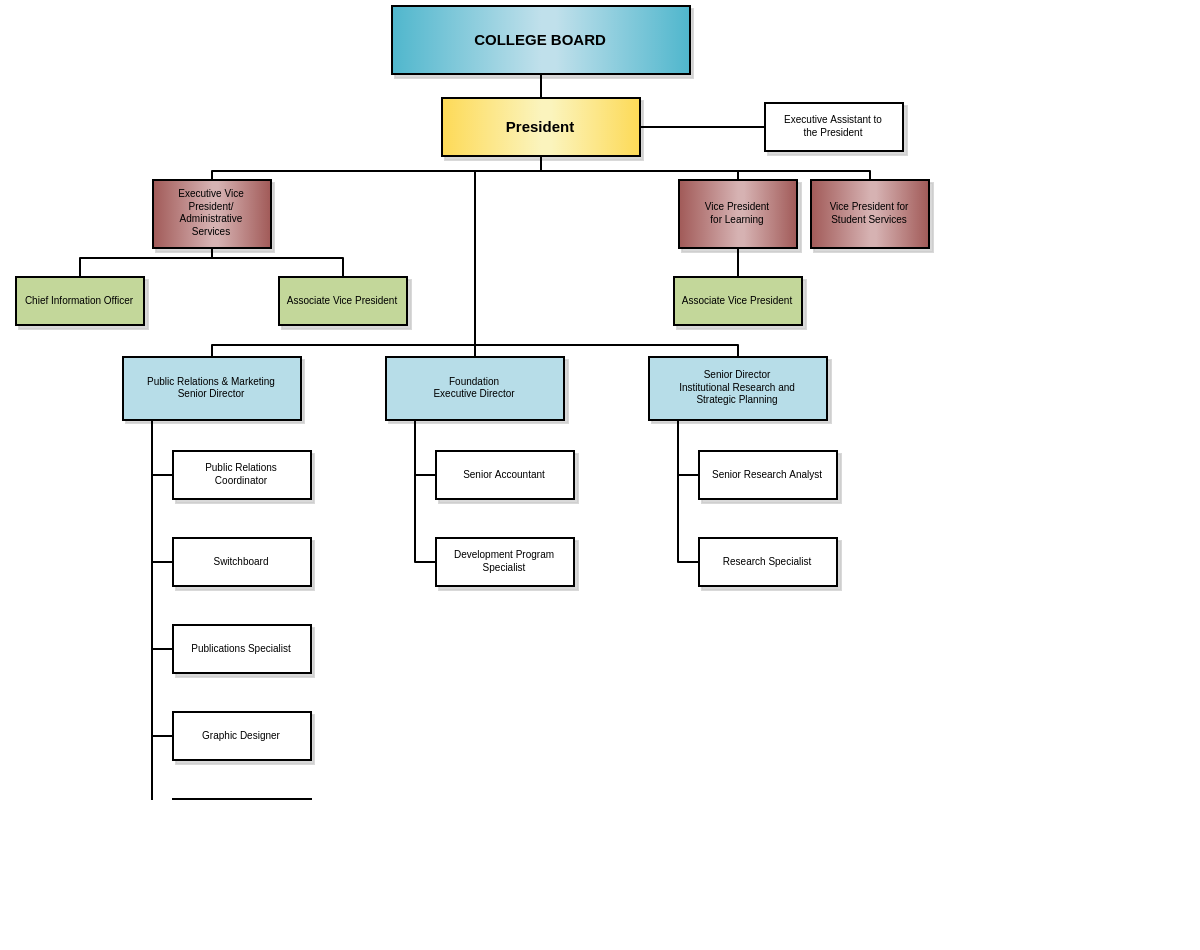
Organizational Diagram
To create an organizational diagram, set type: tree in the root and aspect: 'tree-down in the options object. This is how the organizational chart knows where the parent nodes will start from. You'll also need an orgChart attribute set to true for the organizational charts to function.
Note: You can also set the aspect to 'tree-up', 'tree-right', or 'tree-left, but 'tree-down' is the most commonly used.
{
  options: {
		aspect : 'tree-down',
		orgChart : true,
  }
}
Organizational Diagram Data
Each object in the series array for organizational charts correspond to a node. Each will need an id and name attribute.
These id attributes will be used to target the nodes for parent and sibling attributes that some nodes will contain. The parent attribute and sibling attribute is how we link different nodes together.
Lastly, you'll want to add a cls attribute. This attribute is set to a variable which can then be targeted in the chart JSON so that the individual nodes can be styled.
{
  series: [
    {
      id: 'execasspres',
      name: 'Executive Assistant to<br>the President',
      parent: 'collegeboard',
      sibling: 'president',
      cls: 'bwhite'
    },
  ]
}
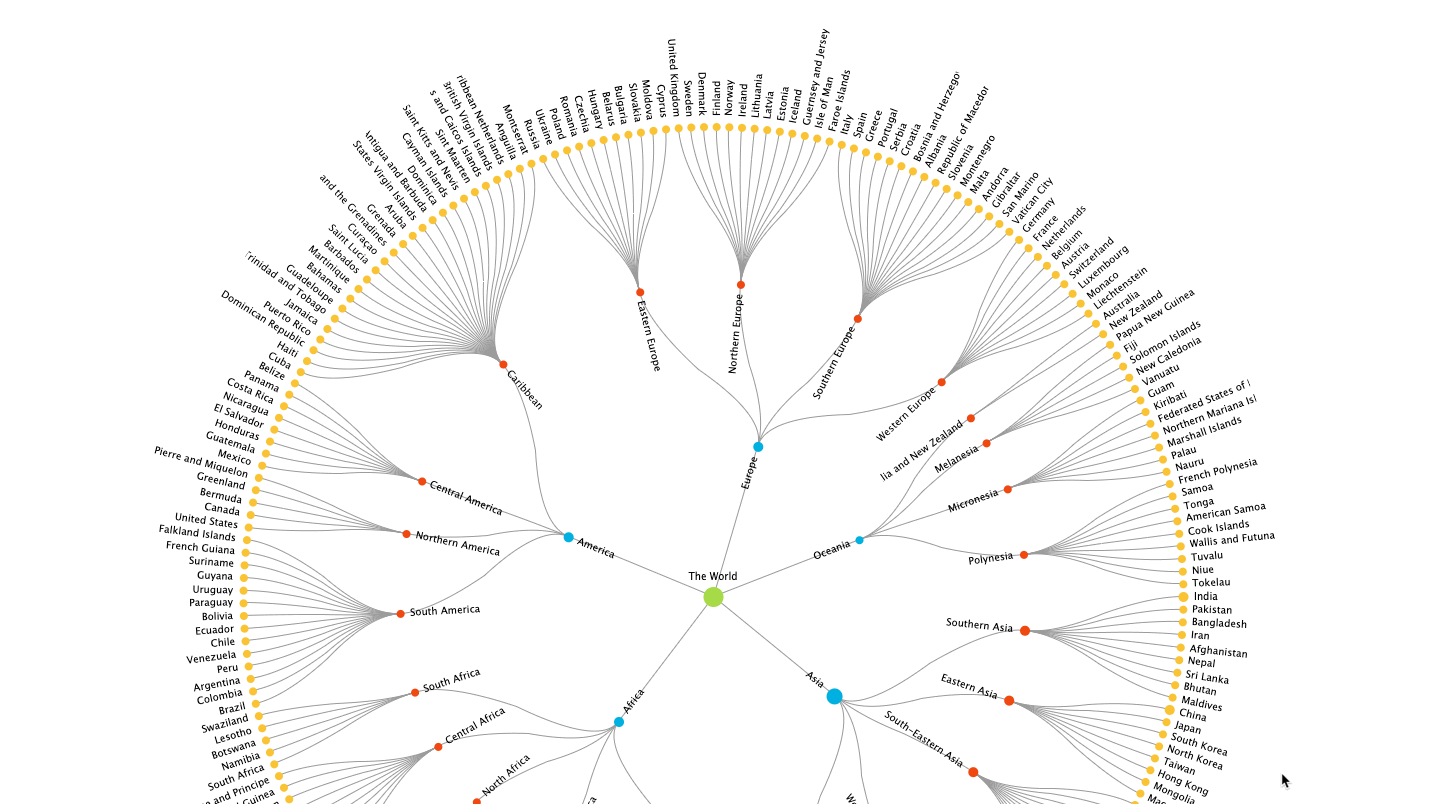
Data
Provide your chart data in the series array. In the array, create an object and assign a value to the id, parent, name, and value, attributes. Alternatively, you can use the group attribute instead of the parent attribute.
id is the node id; parent specifies the parent node id; name is the label of the node; and value is the numerical value of the node object being added. Instead of parent, you can use group to specify which group the node is placed in.
{
  series: [
    {
      id: 'theworld',
      parent: '',
      name: 'The World',
    },
    {
      id: 'asia',
      parent: 'theworld',
      name: 'Asia',
      value: 4100000000
    },
  ]
}
Chart-Specific Properties
Style and customize your tree chart with certain attributes on the options object or dynamically through our API.
Detaching Nodes
You can detach nodes/groups in your diagram dynamically through our API or on render.
// function to separate group from tree diagram
function removeNodeById(id) {
  zingchart.exec('myChart', 'tree.removenode', {
    id,
  });
}
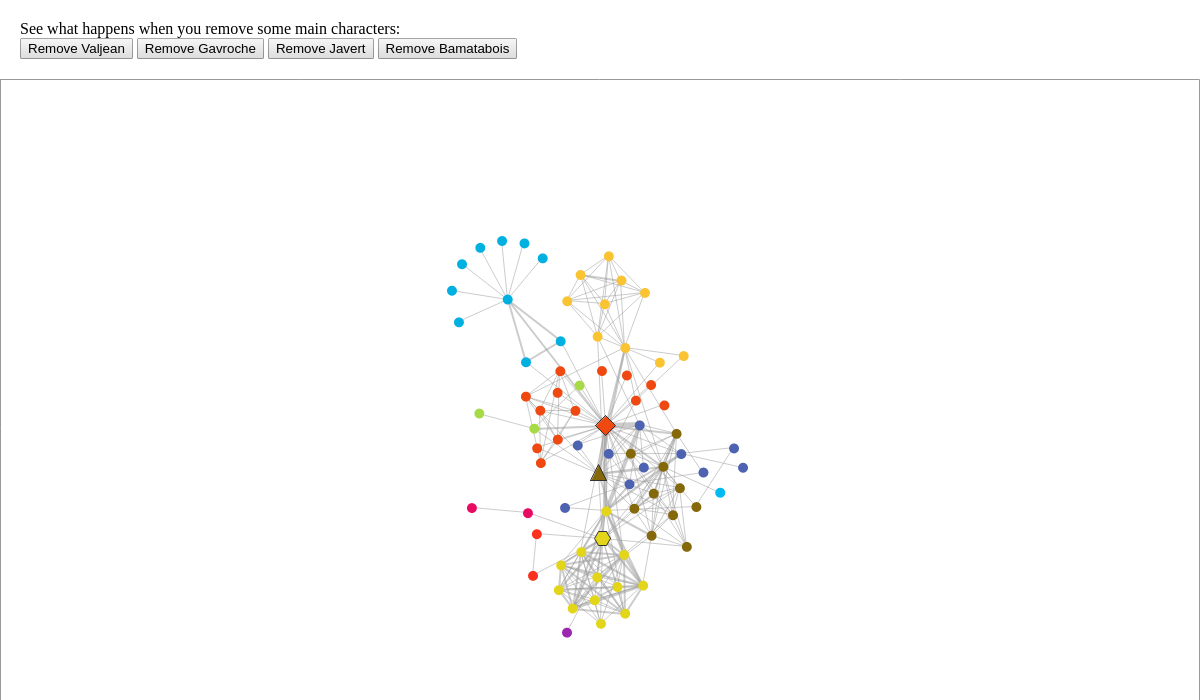
Collapsible Nodes
Collapsible nodes are enabled on tree charts by default. Enable them manually with a weightedLinks attribute in the options object. Enter a value of 0 for true (default) or 1 for false.
{
  options: {
    weightedLinks: 0, // set to 1 to disable collapsible nodes
  }
}
Further Customization
Once you have your basic chart, you can customize and style it to fit your data visualization needs.
Node Connectors
Customize the lines that connect nodes with the link object. Include an aspect attribute with any of these values: arc (default), sibling, side-before, side-after, side-between, split, line.
options: {
  link: {
    aspect: 'arc', // sibling, side-before, side-after, side-between, split, line
  }
}
Nodes
The node object is where the general styling of the nodes is. You can adjust the type, color, shape, size, hover effects here.
Note: Node types are based on ZingChart shapes. Learn more with our Shapes Tutorial.
node: {
  type: 'circle',
  borderWidth: '0px',
  hoverState: {
    borderAlpha: 1,
    borderColor: '#000',
    borderWidth: '2px'
  },
  label: {
    width: '100px'
  },
  tooltip: {}
}
Tokens
Below is a short list of all the available tokens for tree charts:
| Token | Description |
|---|---|
%text |
The chart's text attribute. |
%value |
The nodes overall value. |
%data-xxx |
Custom token to be accessed. |
Tooltip
You can adjust the tooltip value with the node.tooltip object. This object carries all standard styling from the tooltip object.
node: {
  tooltip: {
    padding: '8px 15px',
    text: 'My %text has a value of: %value'
  }
}
Note: Learn more about tooltips with our Tooltips Tutorial. For more tooltip styling options, see our Tooltips JSON Attributes/Syntax page.
Events
Events for clicking nodes will NOT be node_click, and instead will be shape_click because at the core, network diagrams are class shapes and not nodes.
shape_click
Use the shape_click event to fire clicking on nodes and clusters for network diagrams. You can view our object events documentation for more information.
shape_mouseover
Use the shape_mouseover event to fire hovering on nodes. You can view our object events documentation for more information.
Methods
To update the tree, you must use the setdata method.
zingchart.exec('myChart', 'setdata', {
  data: chartConfigObj
});