Chart Internationalization
As a well designed JavaScript charting library, ZingChart supports multiple language character sets (internationalization) right out of the box.
Text
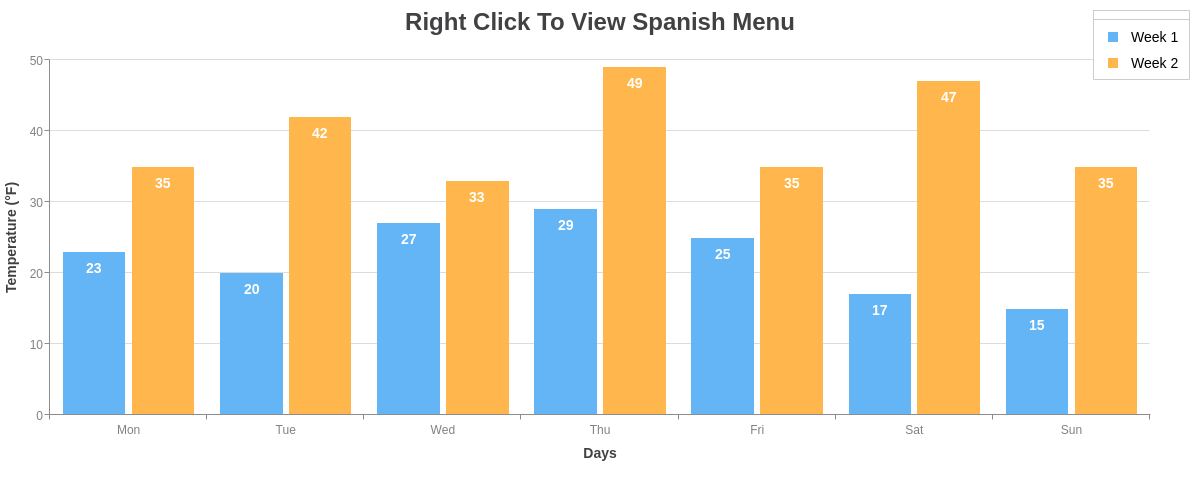
If you want to translate text on the chart, you can do using a locale file that follows our schema.
Locale
The first step to internationalization is setting up a locale file.
Note: The schema for locale file lives on our GitHub page.
let locale = {
    'rtl' : false,
    'decimals-separator' : '.',
    'thousands-separator' : '',
    'menu-reload' : 'Refrescar',
    'menu-print' : 'Imprimir graphíco',
    'menu-viewaspng' : 'Mostrar Cómo PNG',
    ...
  };

  // assign locale file to ZingChart object
  zingchart.i18n.es = locale;

  // full ZingChart schema can be found here:
  // https://www.zingchart.com/docs/api/json-configuration/
  let chartConfig = {
    type: 'bar',
  	locale: 'es', // assign locale to chart
    ...
  };
Time
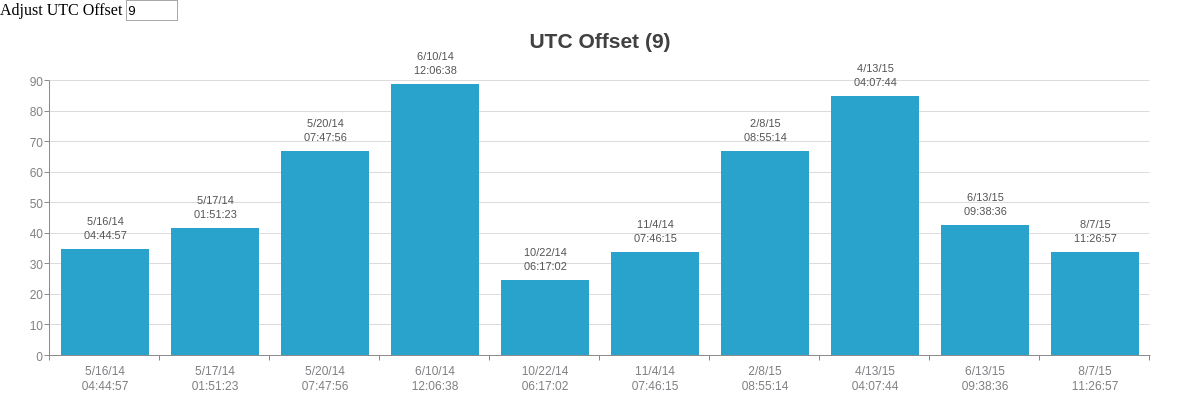
A subset of internationalization is time zones. We allow the setting of time zones through two attributes: utc and timezone. Setting utc:true will allow you to set your UTC offset with the timezone attribute. If your UTC offset is +9, the configuration would like like this:
let chartConfig = {
  type: 'bar',
  utc: true,
  timezone: 9,
  ....
};
Summary
The locale render method option lets you change the labels used for various elements of a chart, including the context-menu and the bug reporter menu. This can really improve usability and make your charts feel really localized.
Don't forget, a comprehensive list of available attributes and objects can be found on our JSON Syntax page.