Tile Maps
Tile Map Chart Type and Options
ZingChart tile maps (aka hex maps) use the type attribute and the options object. In your chart object, add a type attribute and set the value to tilemap. Next, create an options object. Add a map property, and set it to a map name (e.g., USA).
Note: The following are available tile maps: AFRICA, ASIA, AUSTRALIA, EUROPE, NORTHAMERICA, SOUTHAMERICA, USA and WORLDCOUNTRIES.
{
    type: 'tilemap',
    options: {
        map: 'USA',
    },
};

Data
To enter data into the tile map, use the data attribute within the plot object. The data attribute accepts a dataset in the form of an array of objects. The index of each object is titled after the abbreviated name of each tile based on the available regions of the specific map chosen. The object directly affects that tile.
{
    plot: {
        data:
        [
            {obj1},
            {obj2},
            ...,
            {objN}]
        ]
    }
}
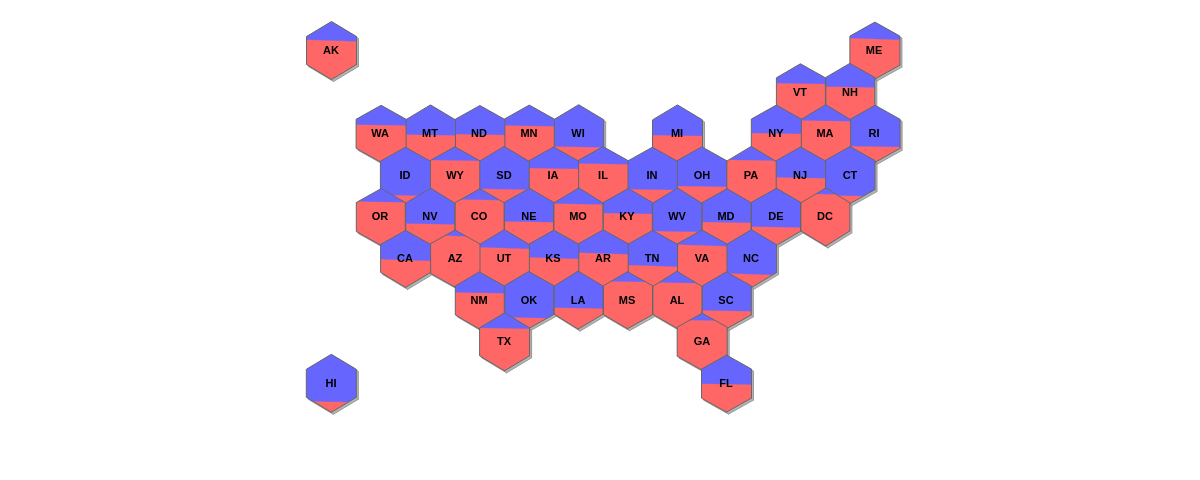
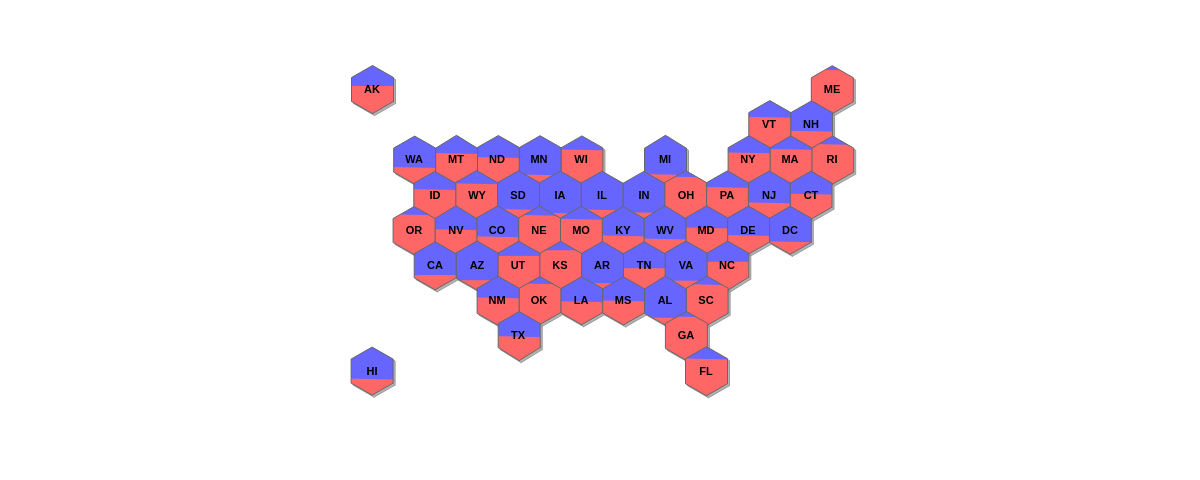
To demonstrate how to add visual data to a tile map, the following example is given:
var IDS = ["AL", "AK", "AZ", "AR", "CA", "CO", "CT", "DE", "DC", "FL", "GA", "HI", "ID", "IL", "IN", "IA", "KS", "KY", "LA", "ME", "MD", "MA", "MI", "MN", "MS", "MO", "MT", "NE", "NV", "NH", "NJ", "NM", "NY", "NC", "ND", "OH", "OK", "OR", "PA", "RI", "SC", "SD", "TN", "TX", "UT", "VT", "VA", "WA", "WV", "WI", "WY"];
var data = {};
for (var i=0;i<IDS.length;i++) {
    var p = ZC._i_(ZC._r_(10, 90));
    data[IDS[i]] = {
        value: 0,
        dataDem: p,
        dataRep: (100-p),
        gradientStops: [0.001, p/100 - 0.01, p/100 + 0.01, 0.999].join(' '),
    };
}

var cdata = {
    type: 'tilemap',
    options:{
        map: 'USA',
        type: 'hex',
        sizeFactor:1.1,
        tile:{
            fillAngle: 1,
            gradientColors: '#66f #66f #f66 #f66',
            shadow: 1,
            borderWidth: 1,
            borderColor: '#666',
            shadowDistance: 4,
            shadowAlpha: 0.75,
            shadowColor: '#999'
        },
        data: data
    }
};
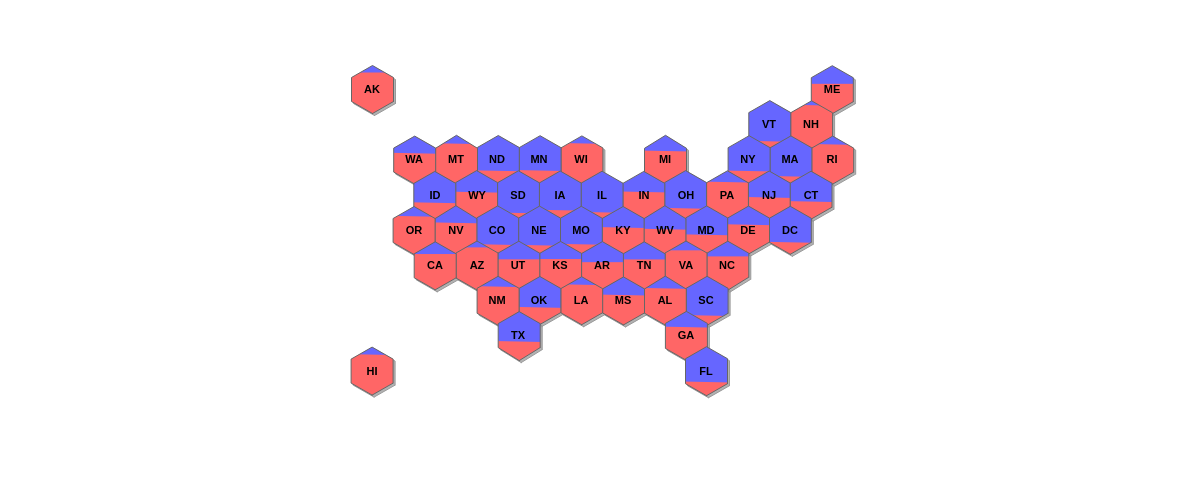
Chart-Specific Properties
Use the options object to configure the tile map and its items with attributes like type, sizeFactor, tile, and more.
Type
Use the type attribute to display a specific shape for the tiles that represent your map. The type value options include: circle, square, and hex (default).
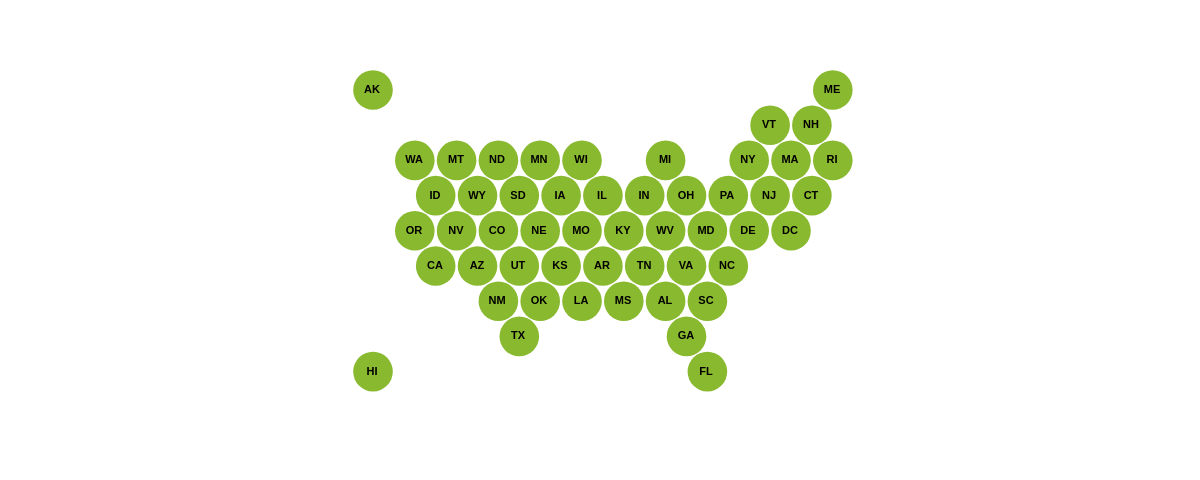
{
    options: {
        type: 'circle' // 'square' | 'hex'
    },
};
Size Factor
Use the sizeFactor attribute to scale the tiles that represent the map. Include a numeric value. The default value is 0.9.
{
    options: {
        sizeFactor: 1
    },
};

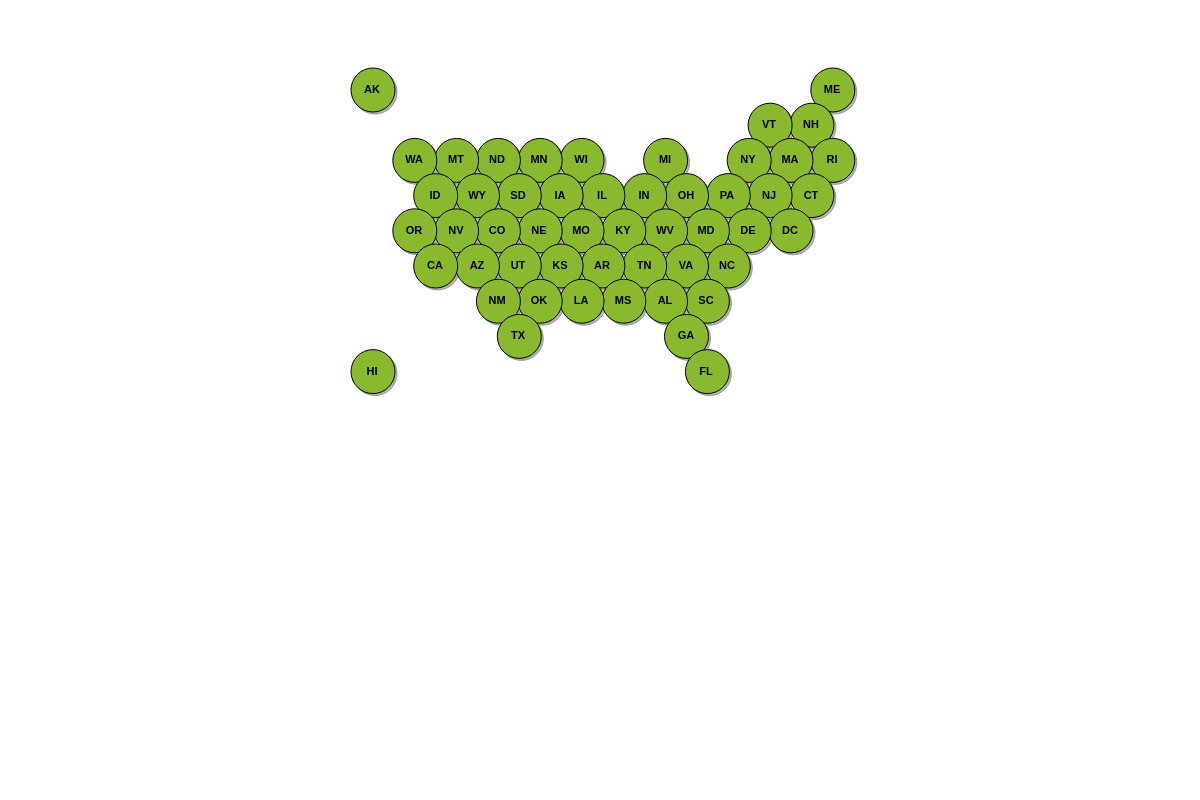
Tile
Use the tile object to style tiles. Some of the attributes for the tile object include: fillAngle, gradientColors, shadow, borderWidth, borderColor, shadowDistance, shadowAlpha, shadowColor, etc.
{
    options: {
        tile: {
          borderWidth: 1,
          borderColor: '#000',
          shadow: 1,
          shadowDistance: 4,
          shadowAlpha: 0.75,
          shadowColor: '#999'
        }
    },
};
Groups
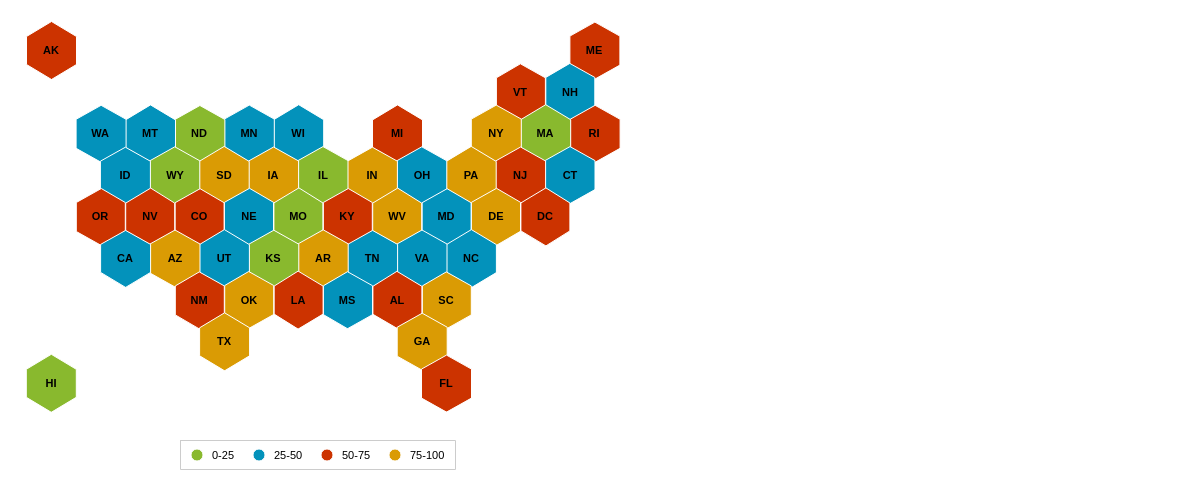
Use the groups attribute to apply features to specific groups of tiles. It accepts an array of objects where each object contains a specific rule.
Note: Learn more about rules with our Rules Tutorial.
{
    options: {
        groups: [
            {
                rule: '%value >= 0 && %value < 25',
                backgroundColor: '#89b92e',
                text: '0-25'
            },
            {
                rule: '%value >= 25 && %value < 50',
                backgroundColor: '#0392bb',
                text: '25-50'
            },
        ]
    }
}
Further Customization
Further customize your tile maps by configuring a few important features to highlight exactly what you want to display.
Tooltip
To enable and style tooltips, add a tooltip object to your chart object. You can turn their visibility on or off with a visible attribute. Set the value to true (default) or false.
Specify what text appears with a text attribute. Place your desired text or tokens inside a string. Style your tooltips (font, background, borders) with attributes such as font-color, font-family, background-color, border-color, border-width, and more.
Note: See our Tooltips JSON Attributes/Syntax page for a full list of styling options.
{
    tooltip: {
        text: "<span style='font-size:21px;font-weight:bold'>%name</span><br><br><span style='color:#00f;font-size:17px'>Democrats:</span> %data-dem%<br><span style='color:#f00;font-size:17px'>Republicans:</span> %data-rep%",
        htmlMode: true,
        padding: 10,
        align: 'left',
        fontSize: 17,
        borderWidth: 1,
        borderColor: '#333',
        fontWeight: '600'
    }
};
Plot Area
With tile map charts, you may want to increase or decrease the size of the entire map. The plotarea object allows adjustments to be made to the entire plot.
Note: More information on the plotarea object is available on our plotarea JSON Configuration page.
{
    plotarea: {
        margin: '10 10 40 10'
    }
};