Selection Tool
This module will allow you to drag and highlight nodes on your chart. Because it's a module, it won't take up any KB on your page unless you are using it. Let's get to why you came here and tell you how it all works.
How To Include The Module
There are two ways to include the module:
- You must first point the
MODULESdirectory path, in the zingchart global object, to the appropriate modules folder.
<script src="cdn.zingchart.com/zingchart.min.js"></script>
<script> zingchart.MODULESDIR = "https://cdn.zingchart.com/modules/";</script>
Load the module using zingchart.loadModules([],fnc). The callback function will be executed upon the script request arriving.
// Load the selection-tool and render the chart once its loaded
zingchart.loadModules('selection-tool', function() {
  zingchart.render({
    id: 'myChart',
    data: myConfig,
    height: 400,
    width: '100%',
    modules: 'selection-tool'
  });
});
- The alternative is to include the script tag directly in the DOM
<script src= "cdn.zingchart.com/zingchart.min.js"></script>
<script src= "cdn.zingchart.com/modules/zingchart-selection-tool.min.js"></script>
How To Style Nodes
If you don't know much about selecting nodes in ZingChart, you should probably read up on the selected-state attribute first. You must apply some sort of selection styling to your chart for the selection tool to work.
For bar charts, you would style something similar to this:
plot: {
  selectedState: {
    backgroundColor: 'red'
  }
}
For line charts, you would style something similar to this:
plot: {
  selectedState: {
    lineColor: 'red'
  },
  // for line marker (nodes)
  selectedMarker: {
    backgroundColor: 'red'
  }
}
How To Select Nodes
- Click + Drag to create rectangular selections
- (Ctrl/Cmnd) + (Click & Drag) to create free form selections.
Styling
You can style the mask of the selection area itself with the following attributes.
selectionTool: {
  mask: {
    borderWidth: 2,
    borderColor: "red", // works for (ctrl/cmnd + click) line color
    backgroundColor: "yellow",
    alpha: 0.5
  }
}
Other Attributes
Append
To append selection for specified plot, use the dataAppendSelection attribute. Otherwise, the previous selection is cleared.
{
  plot: {
    dataAppendSelection: true // set all plots to append selection
  },
  data: [{
    values: ...
    dataAppendSelection: true // specify single plot to append selection
  }]
}
Group
To group select of all nodes within the same scale key, set groupSelections to true.
Note that selectionMode and selectedState are required to set in order for groupSelections to work properly.
{
  plot: {
    selectionMode: 'graph',
    groupSelections: true,
  }
}
Ignore
If you don't want to include a certain plot in your selection tool, use the data-ignore-selection attribute on that plot.
{
  plot: {
    dataIgnoreSelection: true // set all plots to ignore selection
  },
  data: [{
    values: ...
    dataIgnoreSelection: true // specify single plot to ignore selection
  }]
}

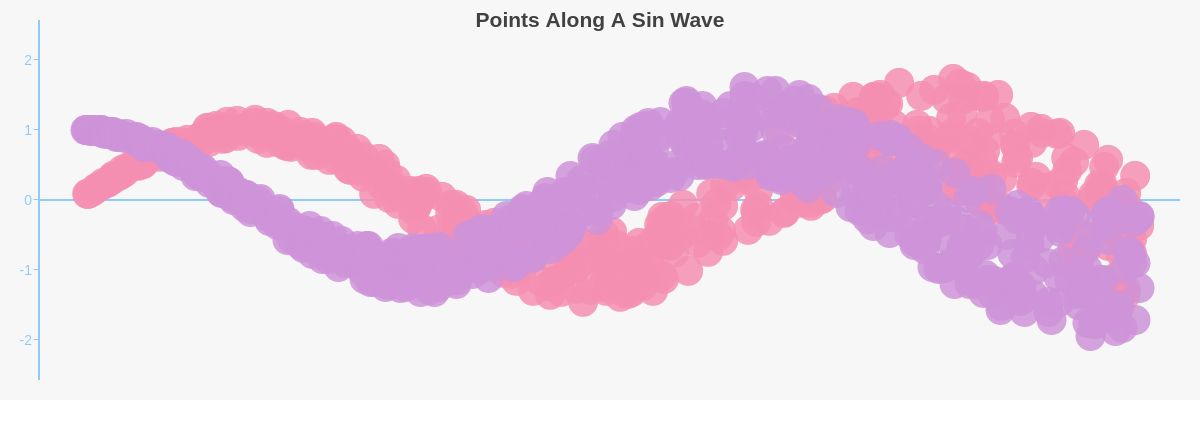
Hello World Demo
How To Use The API
You must register the following code to receive the callback:
zingchart.bind('myChart', 'zingchart.plugins.selection-tool.selection', function(e) {
  ...
});
The API callback parameter e returns the following object:
{
  ev:MouseEvent
  graphid: "myChart-graph-id0"
  id: "myChart"
  nodes: Array[115] // selected node objects
  plotarea:  true
  selection:Array[2] // selected noded indices by plot
  target: "none"
  targetid: "myChart-text-top"
  touch: false
  x: 957
  y: 248
}
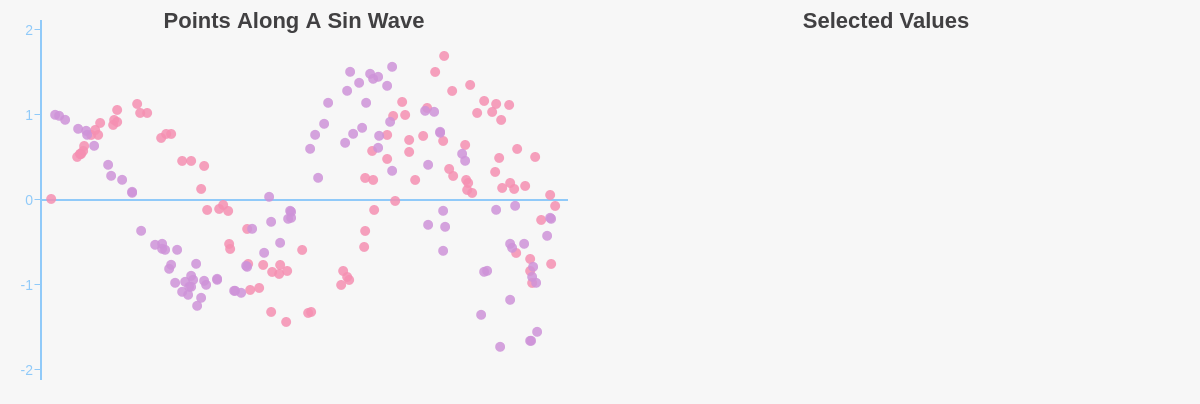
1) Display Selected Values
You can use this information to display say, minValue, maxValue, sumtotal, etc. to your users.
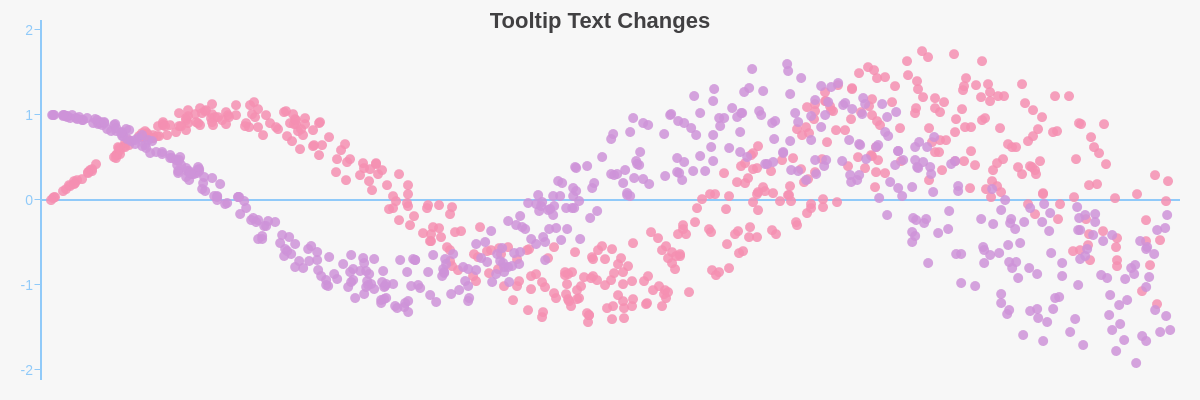
2) Change Tooltip
Additionally, the tooltip of the selected nodes can be changed to display various information. The appropriate syntax is:
tooltip: {
  selectedState: {
    text: series1Text
  }
}
In the following example, I aggregate each plot to display the sum of all values selected in that plot.
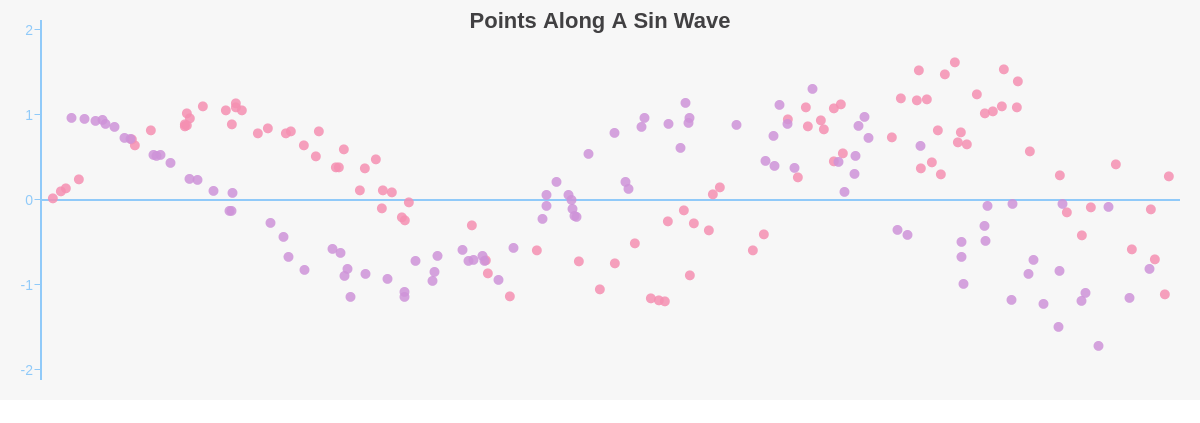
3) Selection Drilldown
You can display a new chart based on the data you have selected from your current chart. I'm using the ZingChart API to update values on the second chart.
// update the second chart
zingchart.exec('selectionChart', 'setseriesdata', {
  data: newSeriesData
});
4) Render A Grid
You can even render a grid based on the selection you have made. In this example, I created a bootstrap table based on this documentation.
How To Clear Selection
It's very easy. Make a call to the clearselection API method. Now let's incorporate this into the chart by adding the function to the context menu. Let's create a place to store our function. Typically it is not recommended to modify the ZingChart object. This is for advanced users. It is good practice to keep all your charting stuff together, in this case your custom functions within the ZingChart object! This will also help with name collisions within the window object.
BE WARNED: You can overwrite stuff in the ZingChart object if you are not careful. Use with caution.
zingchart.insert_company_name_customFncs = {};
zingchart.insert_company_name_customFncs.clearSelection = function(e) {
  zingchart.exec(e.id,'clearselection');
}

// Load the selection-tool and render the chart once the module is loaded
zingchart.loadModules('selection-tool', function() {
    zingchart.render({
        id: 'myChart',
        // defined data this way since context menu needs to be defined in root (above graphset)
        data: {
          gui: {
            contextMenu: {
              customItems: [
                {
                  text: 'Clear Selection',
                  function: 'zingchart.insert_company_name_customFncs.clearSelection()',
                  id: 'clearSelection'
                }
              ]
            }
          },
          graphset: [myConfig]
        },
        height: 400,
        width: '100%',
        modules: 'selection-tool'
    });
});
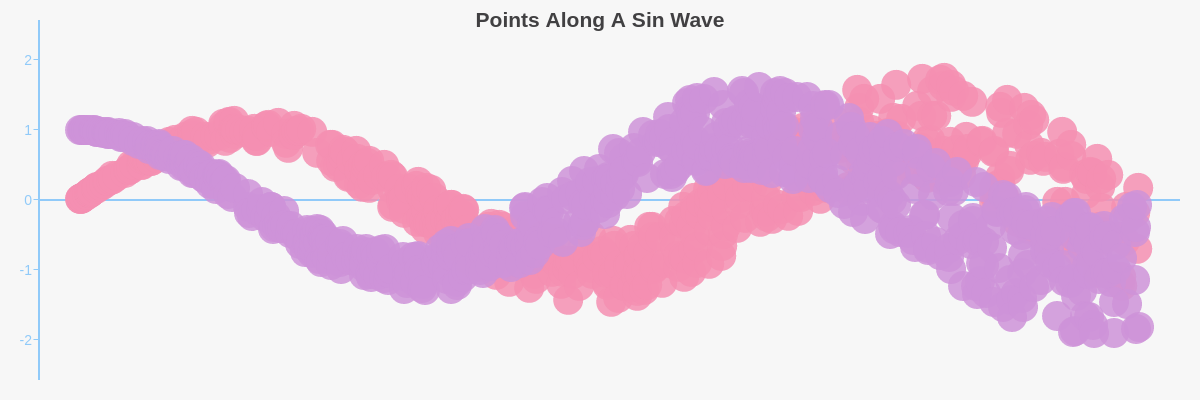
Chart Types
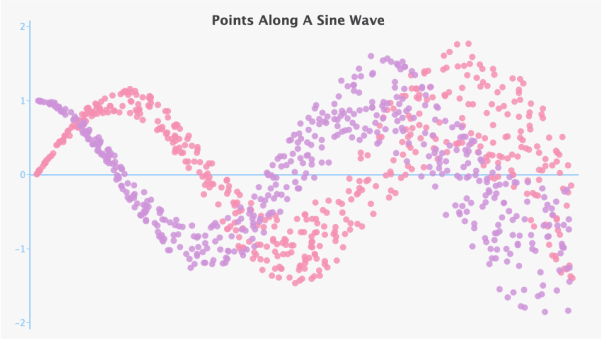
The selection tool makes a lot of sense for scatter plots, but let's see it in action on a couple other chart types to convince you this plugin works on almost all charts.
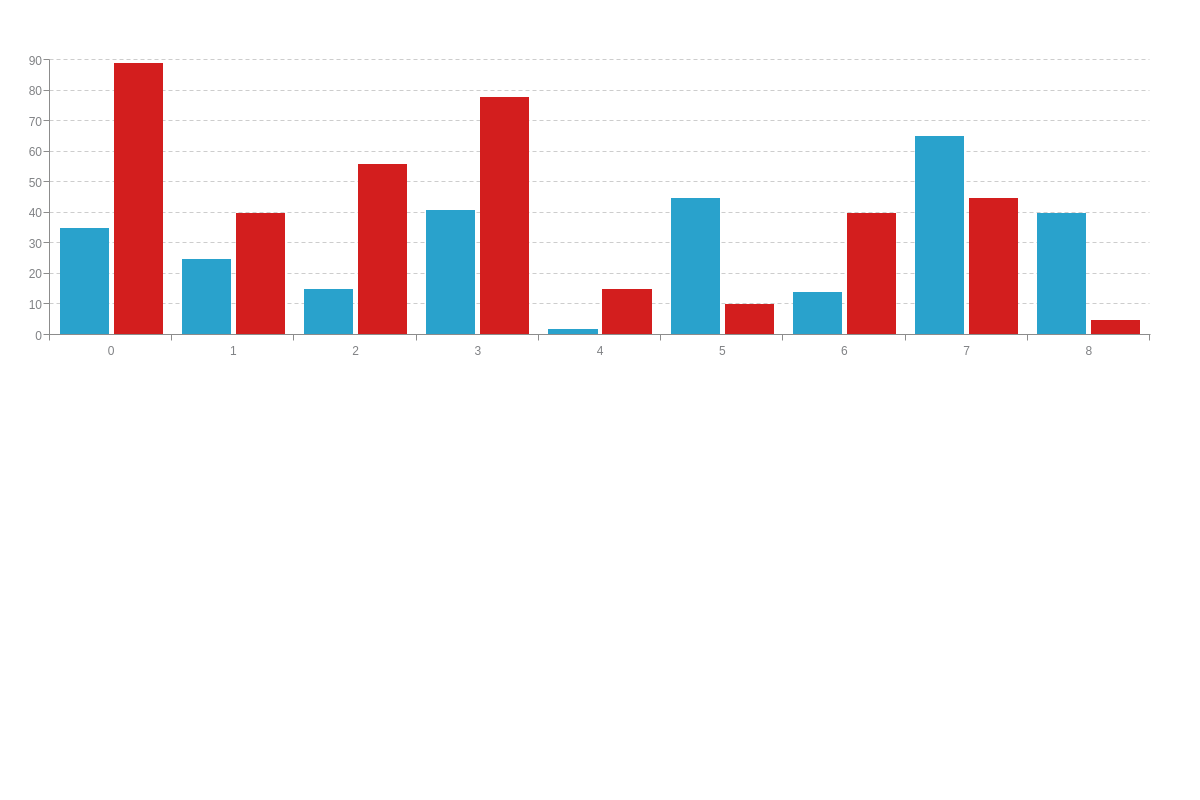
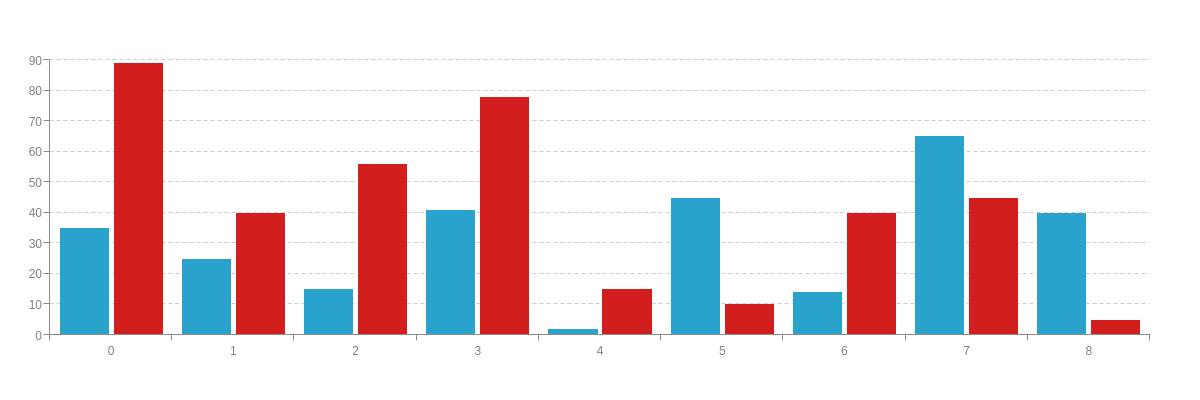
Bar Chart
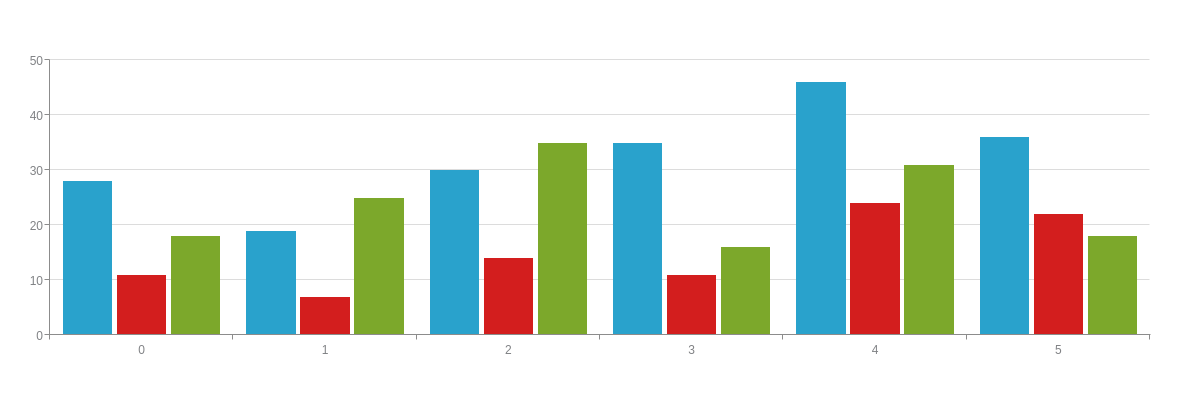
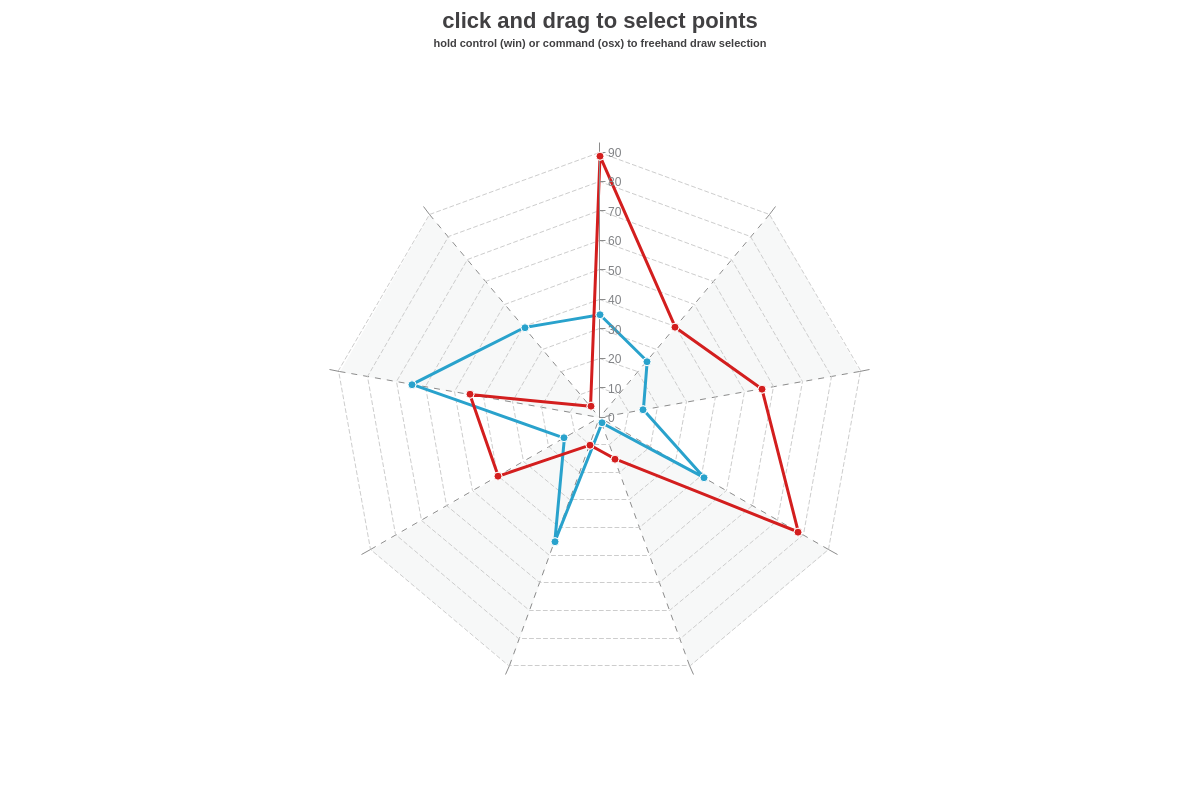
Radar Chart
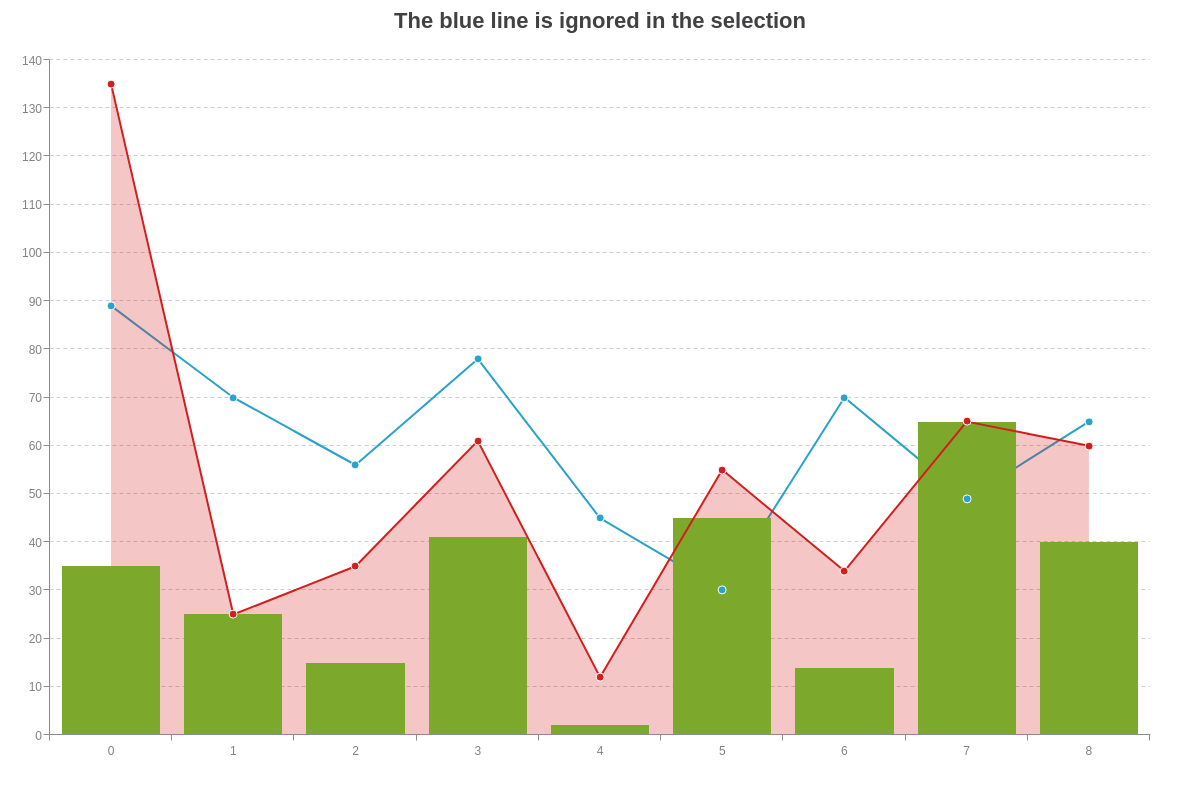
Mixed Chart
If you don't want to include a certain plot in your selection, use the data-ignore-selection attribute on that plot.