Drilldown Charts
History Drilldown
The first step to using the history feature is to place the history object outside of the graphset.
Note: The history object must be placed outside of the graphset object for it to work properly.
history: {
},
graphset: [
    {
        /* Chart JSON Here */
    }
]
Before we connect our series objects to separate JSON packets, we must give our chart an ID so that ZingChart knows where to use the child charts.
history: {
},
graphset: [
    {
        id: "zc",
        /* More Chart JSON Here */
    }
]
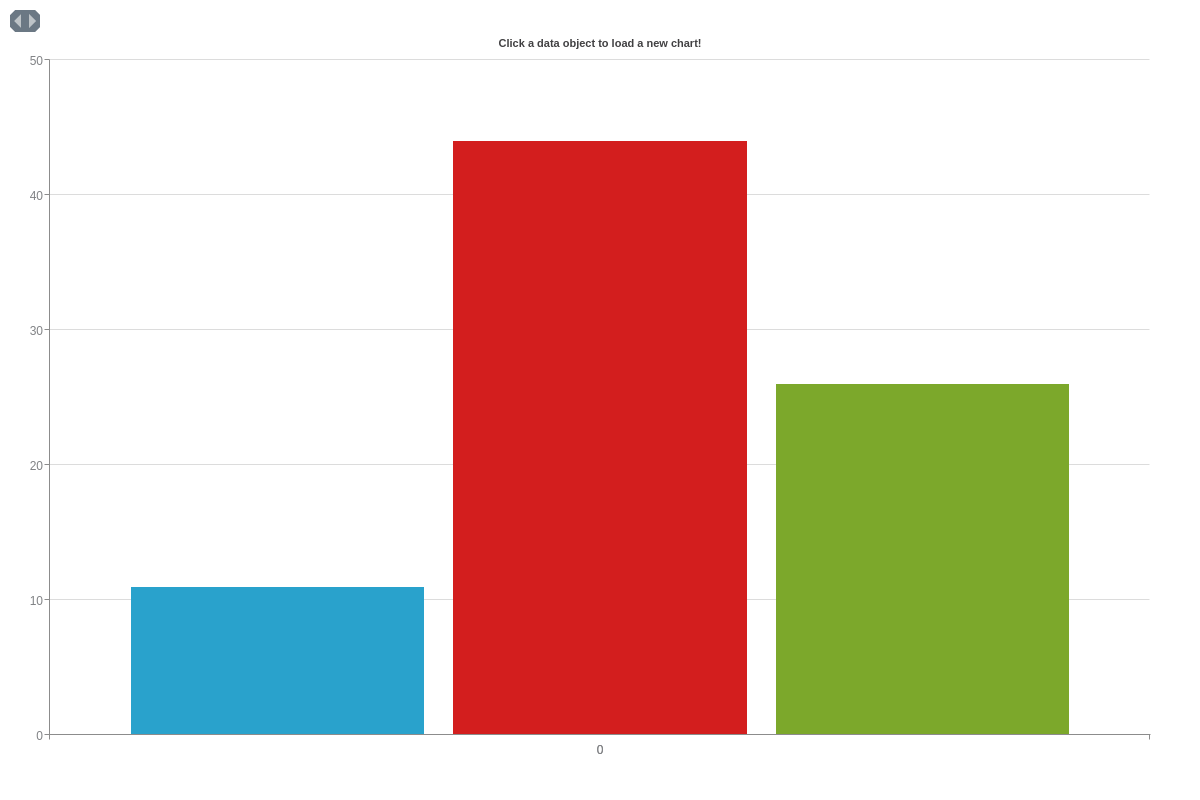
Next, we must configure our series so that clicking on the series data will load a new JSON packet. To do this, we must add the url and target attributes.
series: [
    {
        values: [11],
        url: "https://storage.googleapis.com/zingchart-com.appspot.com/child1.txt",
        target: "graph=zc"
    },
    {
        values: [44],
        url: "https://storage.googleapis.com/zingchart-com.appspot.com/child2.txt",
         target: "graph=zc"
    },
    {
        values: [26],
        url: "https://storage.googleapis.com/zingchart-com.appspot.com/child3.txt",
        target: "graph=zc"
    }
]
History Items
The history item buttons indicate that the user is able to go back and forth between charts.
Though it's not necessary to include the item and item-off attributes, including them allows you to apply a number of styling options.
History Styling
There are a number of attributes that can be used when styling your history, item, and item-off attributes. Each can be individually styled to better fit your drilldown charts.
history: {
    'background-color': "#2c3e50",
    'border-radius': "-5px",
    alpha: "0.7",
    item: {
        'background-color': "#e74c3c",
        'border-width':0
    },
    'item-off': {
        'background-color': "#bdc3c7",
        shadow: false
    }
},
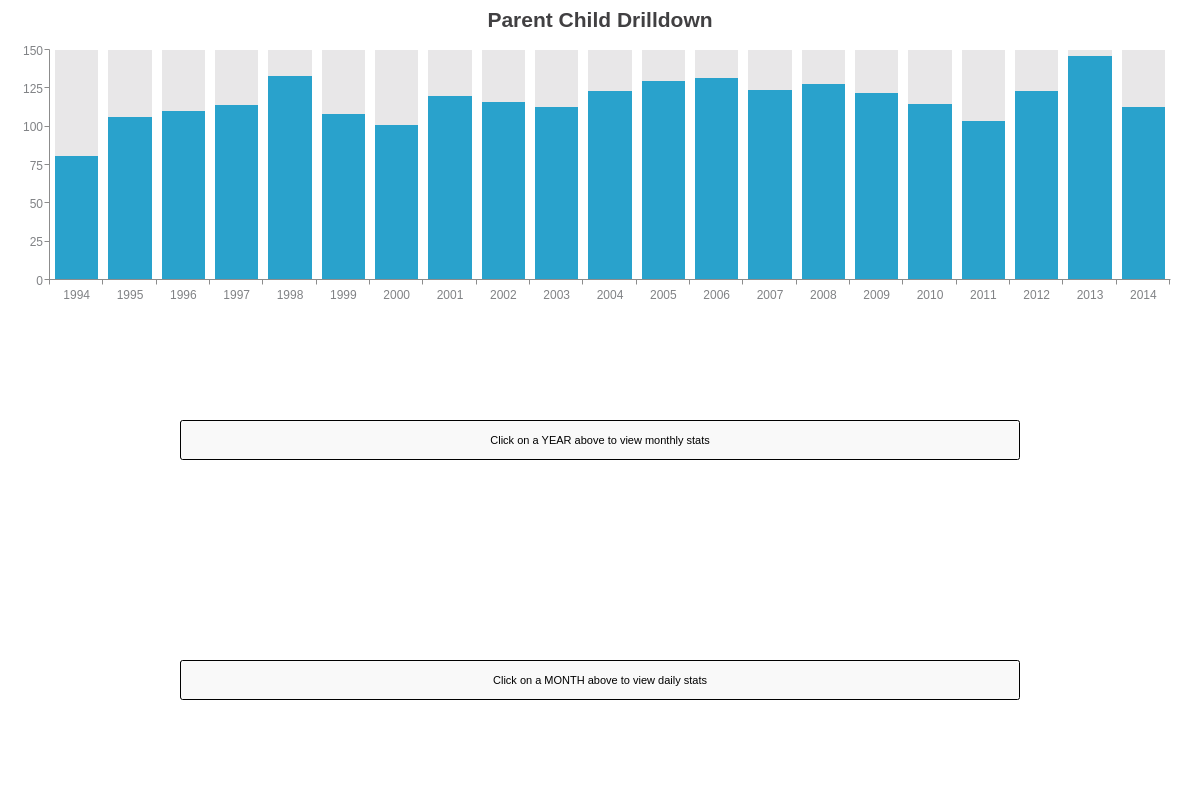
Parent-Child Drilldown
The parent-child drilldown is a great example of utilizing ZingChart's built-in drilldown features. You can define a target for the drilldown config. In this case, we have a graphset of 3 graphs. The top level graph will define a target towards the second graph by id.
{
  target: "graph=months"
}
Within the drilldown chart configuration returned from this endpoint, the next target will be graph=days for the final drilldown chart. You can find the final child configuration here.
Other Drilldown Use Cases
Outside of the standard history object drilldown chart, you can define your own drilldown very easily. You can use shapes and labels to create history buttons. Coupled with our API events and methods, it is very easy to gain more control over your drilldown data. Let's look at a few use cases.
setseriesdata
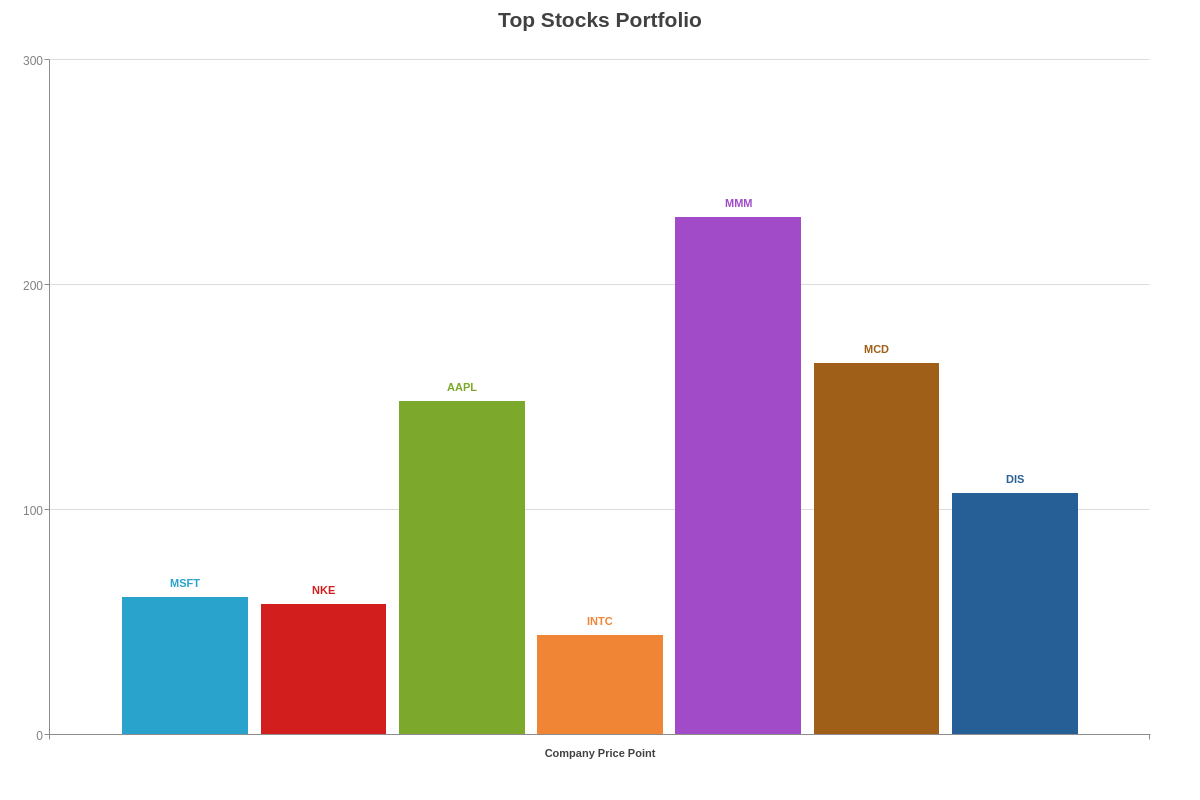
One of the most simple and effective ways to have total control of your drilldown interactions is our API method setseriesdata. This demo utilizes the setseriesdata API method from ZingChart.

AJAX
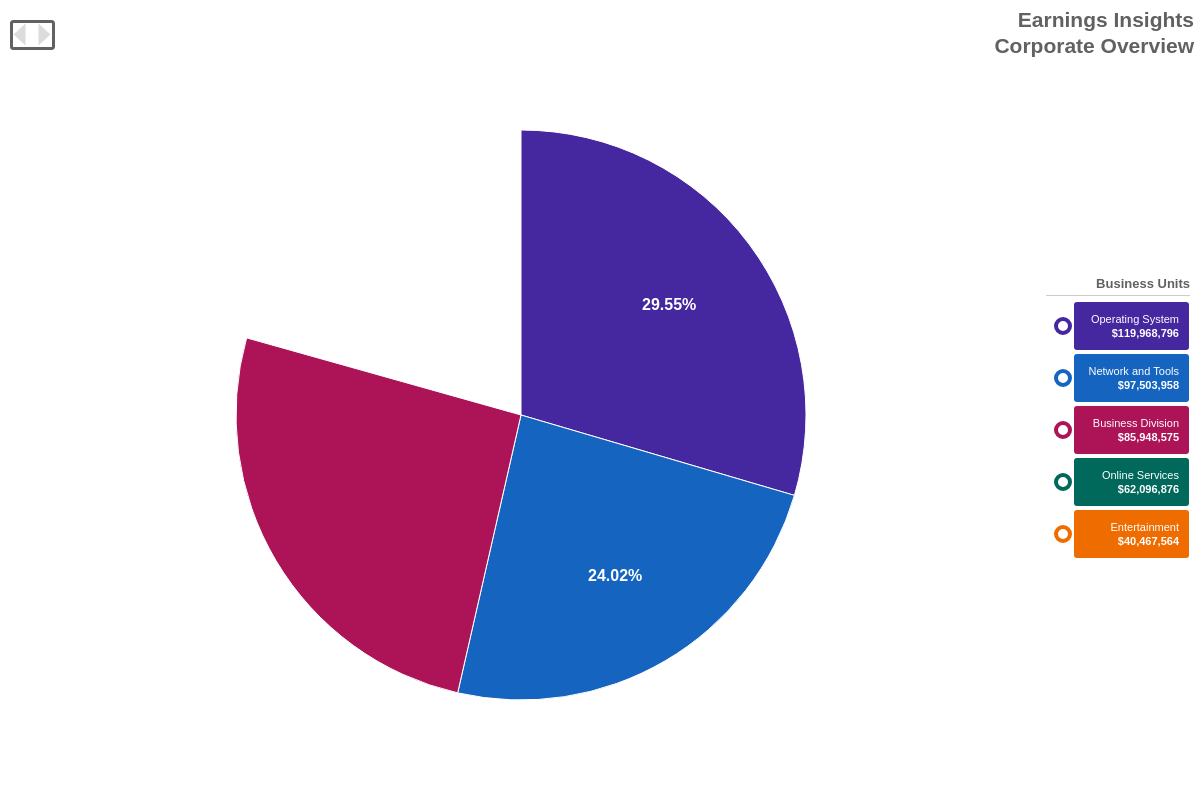
How to gather drilldown data using AJAX and ZingChart. The following demo will load from 12,000 - 130,000 data points for each chart drilldown configuration.
PHP Drilldown
This demo represents a typical REST API call for drilling down into charts. The url specified will take a query parameter and from there, your REST API will return the appropriate chart configuration.
View History Overview
ZingChart offers a history object that works just like the back and forward buttons of an Internet browser to allow users to navigate between multiple loaded charts. To do this, the series' url attribute must first direct to another chart's JSON file. Once this has been done, clicking on the plotted data will bring up the linked JSON packet.
This feature adds a lot of functionality to a chart. It opens up a number of possibilities, including the ability to compare before/after data, quarterly reports, projected vs. actual data, U.S. vs. the competition, and so on.
Summary
The history object is a great and simple way to allow your user to navigate through a number of charts, allowing for chart comparisons and multi-chart drill downs.
Don't forget, a comprehensive list of available attributes and objects can be found on our JSON Syntax page.