Svelte
zingchart-svelte is a Svelte JavaScript directive to allow ZingChart to work dynamically with data. Quickly add charts to your Svelte application with our ZingChart component. This guide assumes some basic working knowledge of Svelte. You can view the full component on GitHub or NPM.
Quickstart Guide
Quickly add charts to your Svelte application with our ZingChart component
This guide assumes some basic working knowledge of Svelte.
1. Install
Install the @zingsoft/zingchart-svelte package as a dev dependency via npm:
npm install -D @zingsoft/zingchart-svelte
or via yarn:
yarn add -D @zingsoft/zingchart-svelte
2. Include the component in your project
You should include the @zingsoft/zingchart-svelte component to your project via modules:
import ZingChart from '@zingsoft/zingchart-svelte';
zingchart Global Object
The zingchart module is a direct dependency of zingchart-svelte so, normally,
you don't need to explicitly import it. If you do want to import it, import
the ES6 version via:
import 'zingchart/es6';
This will create the global zingchart object. Again, this is already handled
by importing the ZingChart Svelte component, but you may want to access the
zingchart global outside of a component in order to configure it, set the
license, etc.:
// zingchart object used to set performance flags
zingchart.DEV.KEEPSOURCE = 0; // prevents lib from storing the original data package
zingchart.DEV.COPYDATA = 0; // prevents lib from creating a copy of the data package

// ZC object used to set license key
zingchart.LICENSE = ['abcdefghijklmnopqrstuvwxy'];
Optional Modules
You will need to import optional ZingChart modules if you intend to use them. For example, if you want to draw a USA map, you would add the maps and USA maps modules via:
import "zingchart/modules-es6/zingchart-maps.min.js";
import "zingchart/modules-es6/zingchart-maps-usa.min.js";
Usage
Here's an example of using the ZingChart component in one of your Svelte components:
<script>
  import ZingChart from '@zingsoft/zingchart-svelte';

  const config = {
    type: 'bar',
    series: [
      { values: [4,5,3,4,5,3,5,4,11] }
    ]
  }
<script>

<ZingChart data={config} />
Properties
The properties, or parameters, you can pass to the <ZingChart> component:
data [object]
const myData = {
    type: 'line',
    series: [
      { values: [1,2,4,5,6] }
    ]
};

<ZingChart data={myData} />
id [string] (optional)
The id for the DOM element for ZingChart to attach to. If no id is specified, the id
will be autogenerated in the form of zingchart-svelte-#.
series [array] (optional)
Accepts an array of series objects, and overrides a series if it was supplied into the config object. Varies according to the chart type used, refer to the ZingChart documentation for more details.
const myData = {
    type: 'line',
};

const mySeries = [
  { values: [1,2,4,5,6] }
];

<ZingChart data={myData} series={mySeries} />
width [string or number] (optional)
The width of the chart. Defaults to 100%.
height [string or number] (optional)
The height of the chart. Defaults to 480px.
theme [object] (optional)
The theme or 'defaults' object defined by ZingChart. More information available here: https://www.zingchart.com/docs/api/themes
modules [string] (optional)
The modules object to load additional modules. More information available here: https://www.zingchart.com/docs/api/zingchart-modules#modules-list
output [string] (optional)
The render type of the chart. The default is svg but you can also pass the string canvas to render the charts in canvas.
Note: All other properties that are added to your ZingChart component will be added
to the zingchart render object. This allows for settings such as 'customprogresslogo',
or any other setting listed in the ZingChart documentation,
to be set. Any unrecognized properties will be ignored.
Events
All zingchart events are readily available on the component to listen to. For example, to listen for the 'complete' event when the chart is finished rendering:
<script>
  import ZingChart from '@zingsoft/zingchart-svelte';

  const config = {
    type: 'line',
    series: [
      { values: [4,5,3,4,5,3,5,4,11] }
    ]
  }

  function chartDone(event) {
    console.log('Event "Complete" - The chart is rendered\n');
  }
</script>

<ZingChart data={config} complete={chartDone} />
For a list of all the events that you can listen to, refer to the complete documentation at https://www.zingchart.com/docs/api/events
Methods
All zingchart methods can be invoked on a ZingChart component via the exec()
method. Just bind a Svelte reference to the component and use it to call exec(),
using the same method name and argument parameters as specified in the ZingChart
documentation (the chart id will be inserted for you). For example, to add
new plot data to an existing chart:
<script>
  import ZingChart from '@zingsoft/zingchart-svelte';

  let chart     // chart reference

  const config = {
    type: 'bar',
    series: [
      { values: [4,5,3,4,5,3,5,4,11] }
    ]
  }

  function addData() {
    chart.exec('addplot', {
      data: {
        values: [5,3,3,5,6,4,3,4,6]
      }
    });
  }
<script>

<div>
  <button on:click={addData}>Add data</button>
  <ZingChart bind:this={chart} data={config} />
</div>
For a list of all the methods that you can call and the parameters each method can take, refer to the complete documentation at https://www.zingchart.com/docs/api/methods
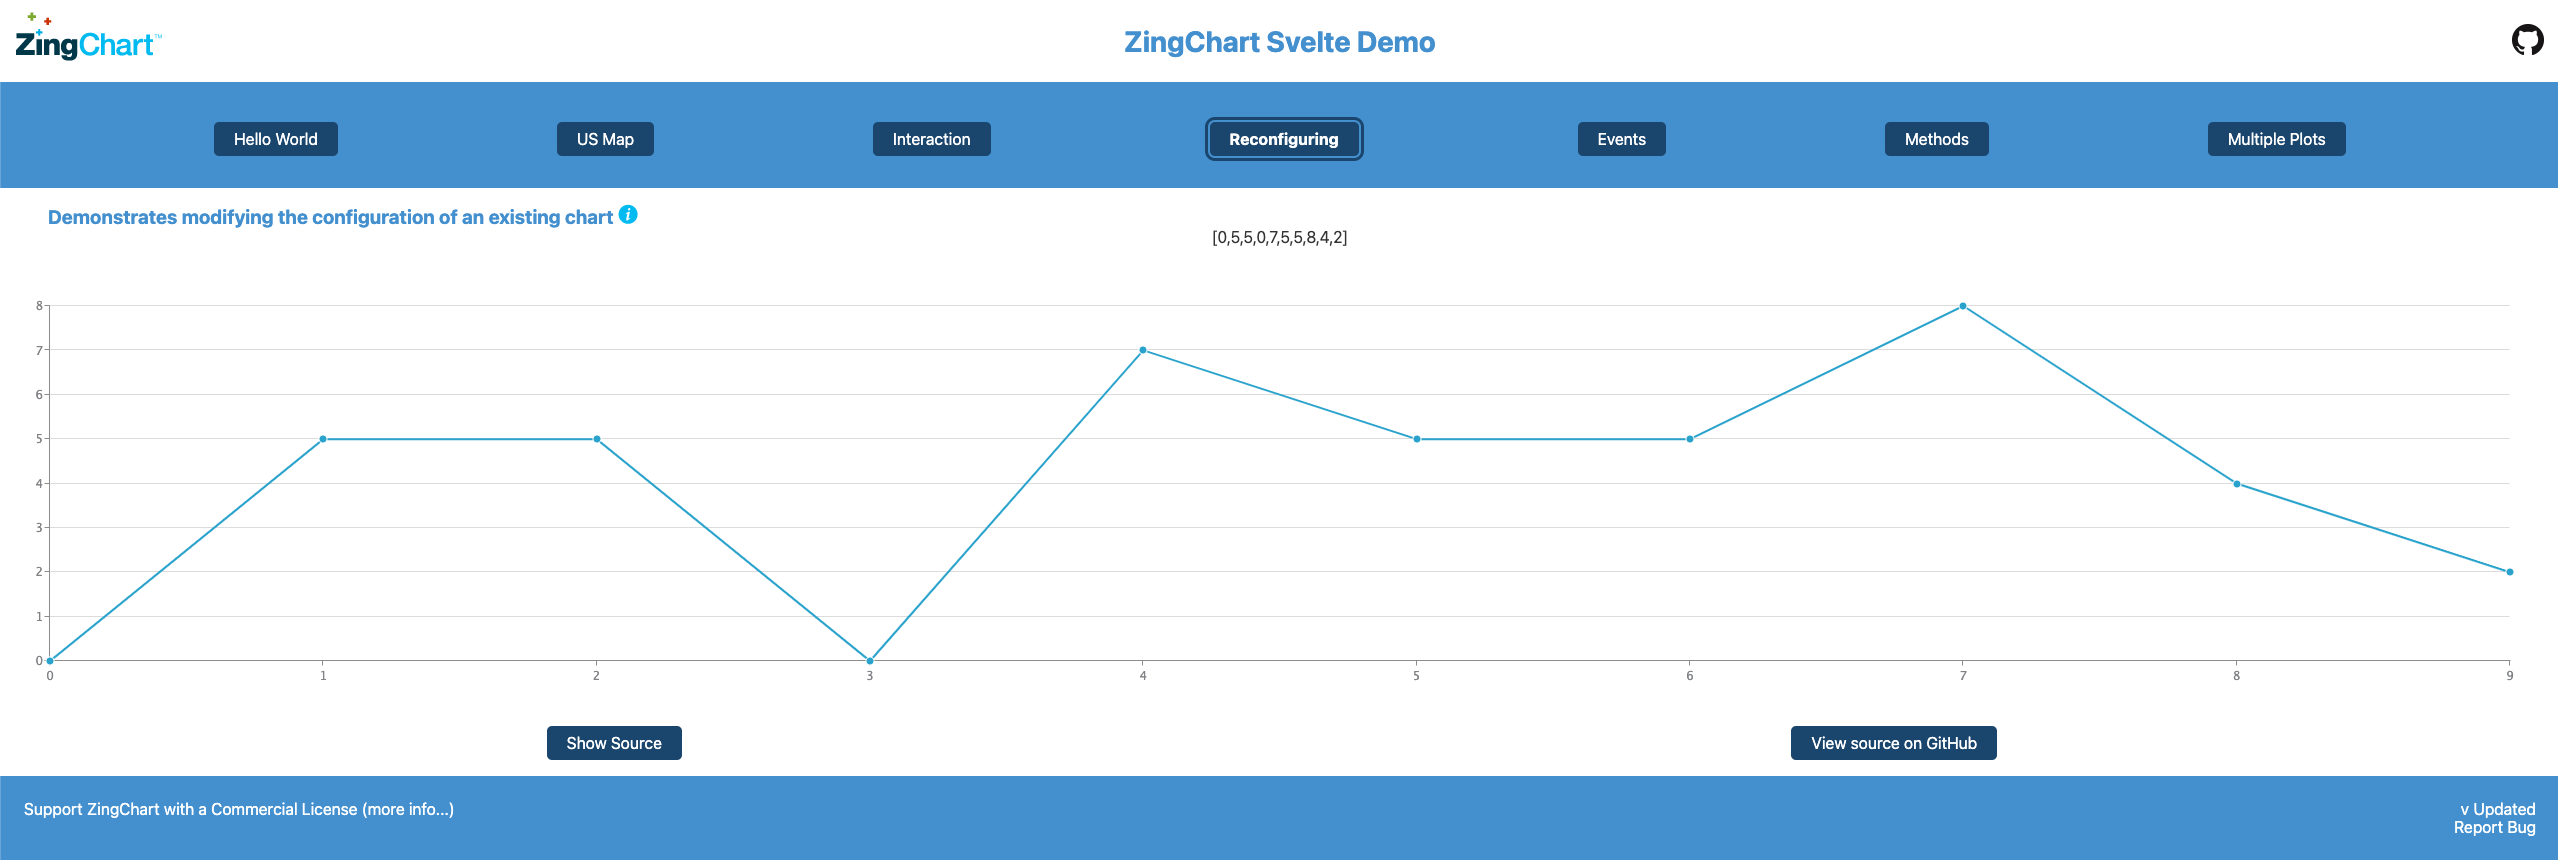
Working Example
See https://github.com/zingchart-demos/zingchart-svelte-demo for a demo that shows this component in action.