Shared Interactions
Overview
The shared feature allows users to interact simultaneously with multiple charts in a graphset. ZingChart currently supports interactive sharing on legends, crosshairs, zooming, and scrolling.
Shared Legend
A shared legend allows users to interact with multiple charts at the same time. All charts must be contained in the same graphset array.
Setup
To enable legend sharing, you need to do the following:
See the following chart. For more on legends generally, including styling and interactive features, refer to the Legend Tutorial.
{
  layout: "3x1",
  graphset: [
    { //Chart One
      type: "line",
      legend: {
        shared: true
      },
      'scale-x': {
        'max-items':11,
        item: {
          'font-size':10
        }
      },
      'scale-y': {
        values: "0:400:200",
        item: {
          'font-size':10
        }
      },
      plotarea: {
        margin: "dynamic"
      },
      series: [
        { values: [ /* Omitted for brevity.*/ ]},
        { values: [ /* Omitted for brevity.*/ ]},
        { values: [ /* Omitted for brevity.*/ ]}
      ]
    },
    { //Chart Two
      type: "line",
      legend: {
        shared: true
      },
      'scale-x': {
        'max-items':11,
        item: {
          'font-size':10
        }
      },
      'scale-y': {
        values: "0:400:200",
        item: {
          'font-size':10
        }
      },
      plotarea: {
        margin: "dynamic"
      },
      series: [
        { values: [ /* Omitted for brevity.*/ ]},
        { values: [ /* Omitted for brevity.*/ ]},
        { values: [ /* Omitted for brevity.*/ ]}
      ]
    },
    { //Chart Three
      type: "line",
      legend: { //Shared Legend
        shared: true,
        draggable: true,
        'drag-handler': "icon",
        header: {
          text: "Legend"
        },
        marker: {
          type: "circle"
        }
      },
      'scale-x': {
        'max-items':11,
        item: {
          'font-size':10
        }
      },
      'scale-y': {
        values: "0:400:200",
        item: {
          'font-size':10
        }
      },
      plotarea: {
        margin: "dynamic"
      },
      series: [
        { values: [ /* Omitted for brevity.*/ ]},
        { values: [ /* Omitted for brevity.*/ ]},
        { values: [ /* Omitted for brevity.*/ ]}
      ]
    }
  ]
}
Examples
Here is a small multiple pie chart with a shared legend.
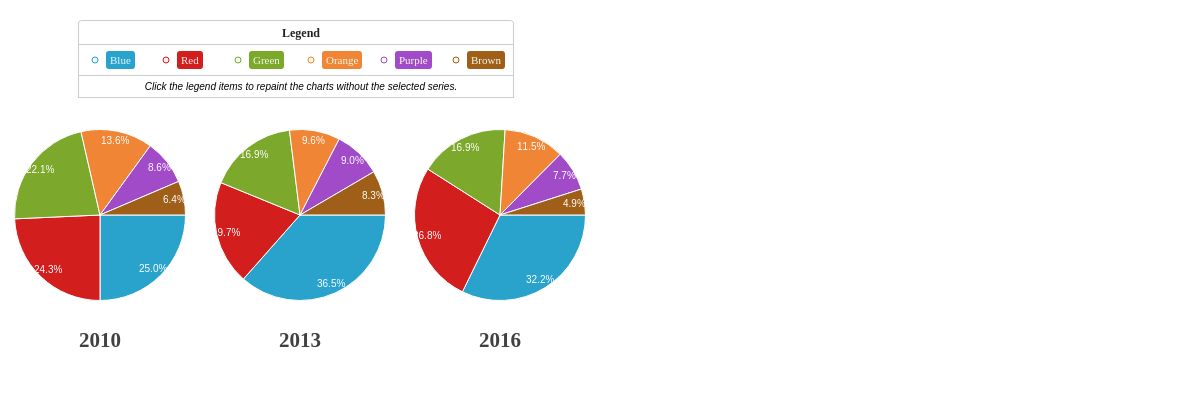
{
  layout: "1x3",
  graphset: [
    {
      type: 'pie',
      legend: {
        shared: true
      },
      title: {
        text: "2010",
        y: "80%",
        'font-family': "Georgia"
      },
      plot: {
        'value-box': {
          'font-size':10,
          'font-weight': "normal",
          'offset-r': "20%"
        }
      },
      series: [
        { values: [35]},
        { values: [34]},
        { values: [31]},
        { values: [19]},
        { values: [12]},
        { values: [9]}
      ]
    },
    {
      type: 'pie',
      legend: {
        shared: true
      },
      title: {
        text: "2013",
        y: "80%",
        'font-family': "Georgia"
      },
      plot: {
        'value-box': {
          'font-size':10,
          'font-weight': "normal",
          'offset-r': "20%"
        }
      },
      series: [
        { values: [65]},
        { values: [35]},
        { values: [30]},
        { values: [17]},
        { values: [16]},
        { values: [15]}
      ]
    },
    {
      type: 'pie',
      legend: {
        shared: true,
        layout: "1x6",
        x: "13%",
        y: "5%",
        'toggle-action': "remove",
        'border-width': 1,
        'border-color': "#cccccc",
        'border-radius': "3px",
        header: {
          text: "Legend",
          'text-align': "center",
          'font-size':12,
          'font-family': "Georgia",
        },
        footer: {
          text: "Click the legend items to repaint the charts without the selected series.",
          'text-align': "center",
          'font-size':10,
          'font-style': "italic",
          'background-color': "white",
          'border-bottom': "1px solid #cccccc",
          'border-left': "1px solid #cccccc",
          'border-right': "1px solid #cccccc"
        },
        item: {
          'font-family': "Georgia",
          'border-radius': "3px"
        },
        marker: {
          type: "circle",
          size:3
        }
      },
      title: {
        text: "2016",
        y: "80%",
        'font-family': "Georgia"
      },
      plot: {
        'value-box': {
          'font-size':10,
          'font-weight': "normal",
          'offset-r': "20%"
        }
      },
      series: [
        {
          values: [59],
          text: "Blue",
          'legend-item': {
            'background-color': "#29A2CC",
            'font-color': "#eaf7fb"
          },
          'legend-marker': {
            'border-color': "#29A2CC",
            'background-color': "#eaf7fb"
          }
        },
        {
          values: [49],
          text: "Red",
          'legend-item': {
            'background-color': "#D31E1E",
            'font-color': "#fce9e9"
          },
          'legend-marker': {
            'border-color': "#D31E1E",
            'background-color': "#fce9e9"
          }
        },
        {
          values: [31],
          text: "Green",
          'legend-item': {
            'background-color': "#7CA82B",
            'font-color': "#f5faeb"
          },
          'legend-marker': {
            'border-color': "#7CA82B",
            'background-color': "#f5faeb"
          }
        },
        {
          values: [21],
          text: "Orange",
          'legend-item': {
            'background-color': "#EF8535",
            'font-color': "#f5faeb"
          },
          'legend-marker': {
            'border-color': "#EF8535",
            'background-color': "#f5faeb"
          }
        },
        {
          values: [14],
          text: "Purple",
          'legend-item': {
            'background-color': "#A14BC9",
            'font-color': "#f5faeb"
          },
          'legend-marker': {
            'border-color': "#A14BC9",
            'background-color': "#f5faeb"
          }
        },
        {
          values: [9],
          text: "Brown",
          'legend-item': {
            'background-color': "#A05F18",
            'font-color': "#f5faeb"
          },
          'legend-marker': {
            'border-color': "#A05F18",
            'background-color': "#f5faeb"
          }
        }
      ]
    }
  ]
}
Shared Crosshairs
Shared crosshairs allow users to view information about two or more charts at the same time. All charts must be contained in the same graphset array.
Setup
To enable shared crosshairs, you need to do the following:
See the following chart. For more on crosshairs generally, including customization and styling, refer to the Crosshairs Tutorial.

{
  layout: "3x1",
  graphset: [
    { //Chart One
      type: "line",
      'crosshair-x': {
        shared: true
      },
      'scale-x': {
        'max-items':11,
        item: {
          'font-size':10
        }
      },
      'scale-y': {
        values: "0:400:200",
        item: {
          'font-size':10
        }
      },
      plot: {
        tooltip: {
          visible: false
        }
      },
      plotarea: {
        margin: "dynamic"
      },
      series: [
        { values: [ /* Omitted for brevity.*/ ]},
        { values: [ /* Omitted for brevity.*/ ]},
        { values: [ /* Omitted for brevity.*/ ]}
      ]
    },
    { //Chart Two
      type: "line",
      'crosshair-x': {
        shared: true
      },
      'scale-x': {
        'max-items':11,
        item: {
          'font-size':10
        }
      },
      'scale-y': {
        values: "0:400:200",
        item: {
          'font-size':10
        }
      },
      plot: {
        tooltip: {
          visible: false
        }
      },
      plotarea: {
        margin: "dynamic"
      },
      series: [
        { values: [ /* Omitted for brevity.*/ ]},
        { values: [ /* Omitted for brevity.*/ ]},
        { values: [ /* Omitted for brevity.*/ ]}
      ]
    },
    { //Chart Three
      type: "line",
      'crosshair-x': {
        shared: true
      },
      'scale-x': {
        'max-items':11,
        item: {
          'font-size':10
        }
      },
      'scale-y': {
        values: "0:400:200",
        item: {
          'font-size':10
        }
      },
      plot: {
        tooltip: {
          visible: false
        }
      },
      plotarea: {
        margin: "dynamic"
      },
      series: [
        { values: [ /* Omitted for brevity.*/ ]},
        { values: [ /* Omitted for brevity.*/ ]},
        { values: [ /* Omitted for brevity.*/ ]}
      ]
    }
  ]
}
Examples
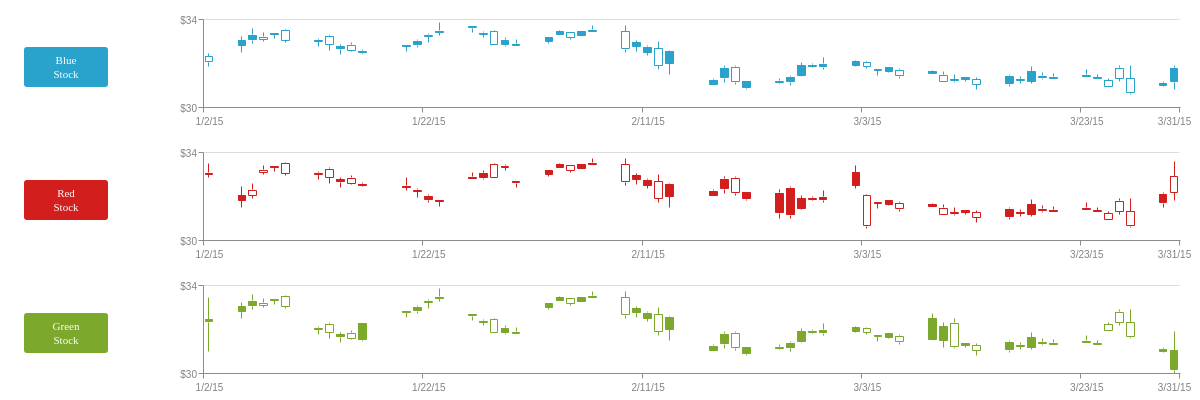
Here is a comparison of three stock funds with shared crosshairs.
{
  layout: "3x1",
  graphset: [
    {
      type: "stock",
      'crosshair-x': {
        'plot-label': {
          text: "Open: $%open<br>High: $%high<br>Low: $%low<br>Close: $%close",
          decimals:2,
          'font-color': "#29A2CC",
          'text-alpha':1,
          'background-color': "white",
          alpha:0.7,
          'border-color': "#29A2CC",
          'border-radius': "3px",
          multiple: true
        },
        'scale-label': {
          visible: false
        },
        'line-color': "#29A2CC",
        shared: true
      },
      'scale-x': {
        'min-value':1420232400000,
        step: "day",
        transform: {
          type: "date",
          all: "%m/%d/%y"
        },
        'max-items':6,
        item: {
          'font-size':10
        }
      },
      'scale-y': {
        values: "30:34:4",
        format: "$%v",
        guide: {
          'line-style': "solid"
        },
        item: {
          'font-size':10
        }
      },
      plot: {
        aspect: "candlestick",
        tooltip: {
          visible: false
        },
        'trend-up': {
          'background-color': "#29A2CC",
          'line-color': "#29A2CC",
          'border-color': "#29A2CC"
        },
        'trend-down': {
          'background-color': "none",
          'line-color': "#29A2CC",
          'border-color': "#29A2CC"
        }
      },
      plotarea: {
        'margin-left': "17%",
        'margin-right': "dynamic",
        'margin-top': "dynamic",
        'margin-bottom': "dynamic"
      },
      labels: [
        {
          text: "Blue<br>Stock",
          'font-family': "Georgia",
          'font-color': "white",
          x: "2%",
          y: "35%",
          height: "30%",
          width: "7%",
          'background-color': "#29A2CC",
          'border-radius': "3px"
        }
      ],
      series: [
        {
          values: [
            //Omitted for brevity.
          ]
        }
      ]
    },
    {
      type: "stock",
      'crosshair-x': {
        'plot-label': {
          text: "Open: $%open<br>High: $%high<br>Low: $%low<br>Close: $%close",
          decimals:2,
          'font-color': "#D31E1E",
          'text-alpha':1,
          'background-color': "white",
          alpha:0.7,
          'border-color': "#D31E1E",
          'border-radius': "3px",
          multiple: true
        },
        'scale-label': {
          visible: false
        },
        'line-color': "#D31E1E",
        shared: true
      },
      'scale-x': {
        'min-value':1420232400000,
        step: "day",
        transform: {
          type: "date",
          all: "%m/%d/%y"
        },
        'max-items':6,
        item: {
          'font-size':10
        }
      },
      'scale-y': {
        values: "30:34:4",
        format: "$%v",
        guide: {
          'line-style': "solid"
        },
        item: {
          'font-size':10
        }
      },
      plot: {
        aspect: "candlestick",
        tooltip: {
          visible: false
        },
        'trend-up': {
          'background-color': "#D31E1E",
          'line-color': "#D31E1E",
          'border-color': "#D31E1E"
        },
        'trend-down': {
          'background-color': "none",
          'line-color': "#D31E1E",
          'border-color': "#D31E1E"
        }
      },
      plotarea: {
        'margin-left': "17%",
        'margin-right': "dynamic",
        'margin-top': "dynamic",
        'margin-bottom': "dynamic"
      },
      labels: [
        {
          text: "Red<br>Stock",
          'font-family': "Georgia",
          'font-color': "white",
          x: "2%",
          y: "35%",
          height: "30%",
          width: "7%",
          'background-color': "#D31E1E",
          'border-radius': "3px"
        }
      ],
      series: [
        {
          values: [
            //Omitted for brevity.
          ]
        }
      ]
    },
    {
      type: "stock",
      'crosshair-x': {
        'plot-label': {
          text: "Open: $%open<br>High: $%high<br>Low: $%low<br>Close: $%close",
          decimals:2,
          'font-color': "#7CA82B",
          'text-alpha':1,
          'background-color': "white",
          alpha:0.7,
          'border-color': "#7CA82B",
          'border-radius': "3px",
          multiple: true
        },
        'scale-label': {
          'font-color': "gray",
          'background-color': "white",
          'border-width': 1,
          'border-color': "gray",
          'border-radius': "3px"
        },
        'line-color': "#7CA82B",
        shared: true
      },
      'scale-x': {
        'min-value':1420232400000,
        step: "day",
        transform: {
          type: "date",
          all: "%m/%d/%y"
        },
        'max-items':6,
        item: {
          'font-size':10
        }
      },
      'scale-y': {
        values: "30:34:4",
        format: "$%v",
        guide: {
          'line-style': "solid"
        },
        item: {
          'font-size':10
        }
      },
      plot: {
        aspect: "candlestick",
        tooltip: {
          visible: false
        },
        'trend-up': {
          'background-color': "#7CA82B",
          'line-color': "#7CA82B",
          'border-color': "#7CA82B"
        },
        'trend-down': {
          'background-color': "none",
          'line-color': "#7CA82B",
          'border-color': "#7CA82B"
        }
      },
      plotarea: {
        'margin-left': "17%",
        'margin-right': "dynamic",
        'margin-top': "dynamic",
        'margin-bottom': "dynamic"
      },
      labels: [
        {
          text: "Green<br>Stock",
          'font-family': "Georgia",
          'font-color': "white",
          x: "2%",
          y: "35%",
          height: "30%",
          width: "7%",
          'background-color': "#7CA82B",
          'border-radius': "3px"
        }
      ],
      series: [
        {
          values: [
            //Omitted for brevity.
          ]
        }
      ]
    }
  ]
}
Shared Zooming
Shared zooming allows users to zoom in on two or more charts at the same time. All charts must be contained in the same graphset array.
Setup
To enable shared zooming, you need to do the following:
See the following chart. For more on zooming generally, including customization and styling, refer to the Zooming, Scrollbar, and Preview Chart Tutorial.
{
  layout: "3x1",
  graphset: [
    { //Chart One
      type: "line",
      zoom: {
        shared: true
      },
      'scale-x': {
        zooming: true,
        'max-items':11,
        item: {
          'font-size':10
        },
      },
      'scale-y': {
        values: "0:400:200",
        item: {
          'font-size':10
        }
      },
      plotarea: {
        margin: "dynamic"
      },
      series: [
        { values: [ /* Omitted for brevity.*/ ]},
        { values: [ /* Omitted for brevity.*/ ]},
        { values: [ /* Omitted for brevity.*/ ]}
      ]
    },
    { //Chart Two
      type: "line",
      zoom: {
        shared: true
      },
      'scale-x': {
        zooming: true,
        'max-items':11,
        item: {
          'font-size':10
        },
      },
      'scale-y': {
        values: "0:400:200",
        item: {
          'font-size':10
        }
      },
      plotarea: {
        margin: "dynamic"
      },
      series: [
        { values: [ /* Omitted for brevity.*/ ]},
        { values: [ /* Omitted for brevity.*/ ]},
        { values: [ /* Omitted for brevity.*/ ]}
      ]
    },
    { //Chart Three
      type: "line",
      zoom: {
        shared: true
      },
      'scale-x': {
        zooming: true,
        'max-items':11,
        item: {
          'font-size':10
        }
      },
      'scale-y': {
        values: "0:400:200",
        item: {
          'font-size':10
        }
      },
      plotarea: {
        margin: "dynamic"
      },
      series: [
        { values: [ /* Omitted for brevity.*/ ]},
        { values: [ /* Omitted for brevity.*/ ]},
        { values: [ /* Omitted for brevity.*/ ]}
      ]
    }
  ]
}
Examples
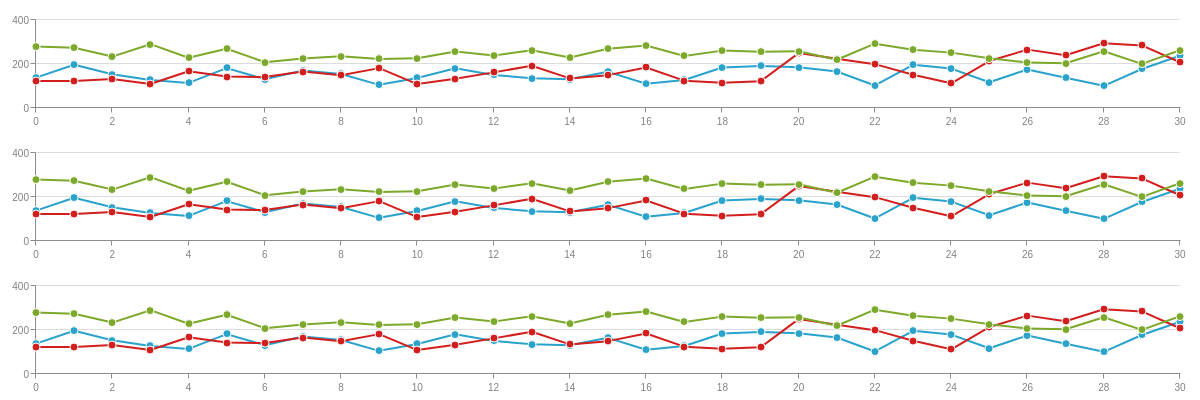
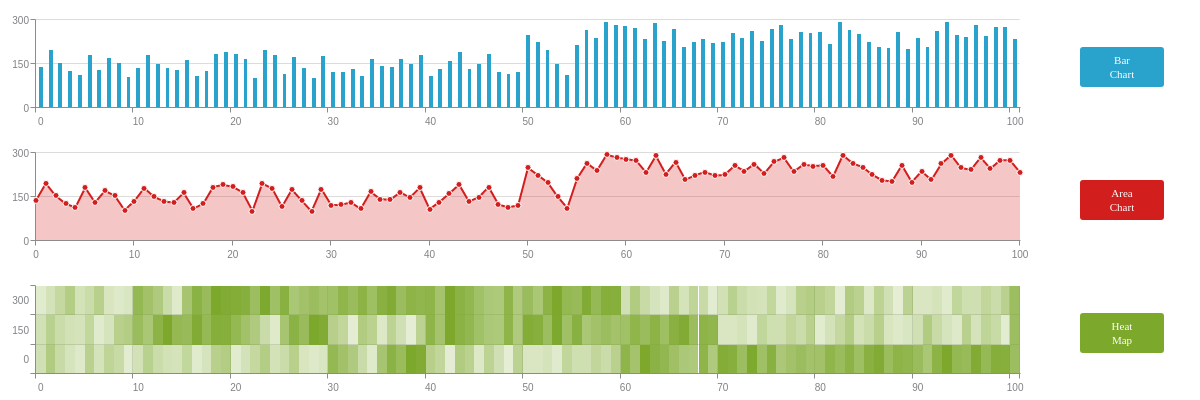
Here are three charts-a bar chart, area chart, and heat map-with shared zooming.
Note: Using blended scales in a mixed chart is another way to achieve the same shared zooming effect between two or more charts in a graphset .
{
  layout: "3x1",
  graphset: [
    {
      type: 'bar',
      zoom: {
        shared: true,
        'background-color': "#29A2CC",
        label: {
          visible: true,
          'font-color': "#29A2CC",
          'font-family': "Georgia",
          'border-color': "#29A2CC",
          padding: "3%"
        }
      },
      'scale-x': {
        zooming: true,
        'max-items':11,
        item: {
          'font-size':10
        }
      },
      'scale-y': {
        values: "0:300:150",
        item: {
          'font-size':10
        }
      },
      plot: {
        'bar-width': "50%",
        'background-color': "#29A2CC"
      },
      plotarea: {
        'margin-left': "dynamic",
        'margin-right': "15%",
        'margin-top': "dynamic",
        'margin-bottom': "dynamic"
      },
      labels: [
        {
          text: "Bar<br>Chart",
          'font-family': "Georgia",
          'font-color': "white",
          x: "90%",
          y: "35%",
          height: "30%",
          width: "7%",
          'background-color': "#29A2CC",
          'border-radius': "3px"
        }
      ],
      series: [
        { values: [ /* Omitted for brevity */]}
      ]
    },
    {
      type: "area",
      zoom: {
        shared: true,
        'background-color': "#D31E1E",
        label: {
          visible: true,
          'font-color': "#D31E1E",
          'font-family': "Georgia",
          'border-color': "#D31E1E",
          padding: "3%"
        }
      },
      'scale-x': {
        zooming: true,
        'max-items':11,
        item: {
          'font-size':10
        }
      },
      'scale-y': {
        values: "0:300:150",
        item: {
          'font-size':10
        }
      },
      plot: {
        'line-color': "#D31E1E",
        marker: {
          size:3,
          'background-color': "#D31E1E"
        },
        'background-color': "#D31E1E"
      },
      plotarea: {
        'margin-left': "dynamic",
        'margin-right': "15%",
        'margin-top': "dynamic",
        'margin-bottom': "dynamic"
      },
      labels: [
        {
          text: "Area<br>Chart",
          'font-family': "Georgia",
          'font-color': "white",
          x: "90%",
          y: "35%",
          height: "30%",
          width: "7%",
          'background-color': "#D31E1E",
          'border-radius': "3px"
        }
      ],
      series: [
        { values: [ /* Omitted for brevity */]}
      ]
    },
    {
      type: "heatmap",
      zoom: {
        shared: true,
        'background-color': "#7CA82B",
        label: {
          visible: true,
          'font-color': "#7CA82B",
          'font-family': "Georgia",
          'border-color': "#7CA82B",
          padding: "3%"
        }
      },
      'scale-x': {
        zooming: true,
        'max-items':11,
        item: {
          'font-size':10
        }
      },
      'scale-y': {
        values: "0:300:150",
        item: {
          'font-size':10
        }
      },
      plot: {
        'line-color': "#7CA82B",
        'background-color': "#7CA82B",
        marker: {
          'background-color': "#7CA82B"
        }
      },
      plotarea: {
        'margin-left': "dynamic",
        'margin-right': "15%",
        'margin-top': "dynamic",
        'margin-bottom': "dynamic"
      },
      labels: [
        {
          text: "Heat<br>Map",
          'font-family': "Georgia",
          'font-color': "white",
          x: "90%",
          y: "35%",
          height: "30%",
          width: "7%",
          'background-color': "#7CA82B",
          'border-radius': "3px"
        }
      ],
      series: [
        { values: [ /* Omitted for brevity */]}
        { values: [ /* Omitted for brevity */]}
        { values: [ /* Omitted for brevity */]}
      ]
    }
  ]
}
Shared Scrolling
Shared scrolling allows users to scroll through two or more charts at the same time. All charts must be contained in the same graphset array.
Setup
To enable shared scrolling, you need to do the following:
See the following chart. For more on zooming and scrolling generally, including styling and customization, refer to the Zooming, Scrollbar, and Preview Chart Tutorial.
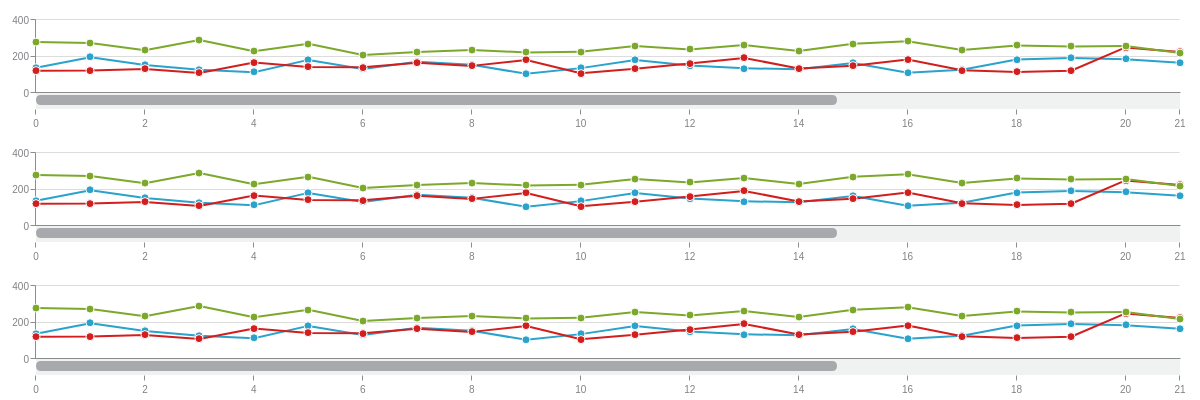
{
  layout: "3x1",
  graphset: [
    { //Chart One
      type: "line",
      zoom: {
        shared: true
      },
      'scroll-x': {

      },
      'scale-x': {
        zooming: true,
        'zoom-to': [0,21],
        'max-items':11,
        item: {
          'font-size':10
        },
      },
      'scale-y': {
        values: "0:400:200",
        item: {
          'font-size':10
        }
      },
      plotarea: {
        margin: "dynamic"
      },
      series: [
        { values: [ /* Omitted for brevity.*/ ]},
        { values: [ /* Omitted for brevity.*/ ]},
        { values: [ /* Omitted for brevity.*/ ]}
      ]
    },
    { //Chart Two
      type: "line",
      zoom: {
        shared: true
      },
      'scroll-x': {

      },
      'scale-x': {
        zooming: true,
        'zoom-to': [0,21],
        'max-items':11,
        item: {
          'font-size':10
        },
      },
      'scale-y': {
        values: "0:400:200",
        item: {
          'font-size':10
        }
      },
      plotarea: {
        margin: "dynamic"
      },
      series: [
        { values: [ /* Omitted for brevity.*/ ]},
        { values: [ /* Omitted for brevity.*/ ]},
        { values: [ /* Omitted for brevity.*/ ]}
      ]
    },
    { //Chart Three
      type: "line",
      zoom: {
        shared: true
      },
      'scroll-x': {

      },
      'scale-x': {
        zooming: true,
        'zoom-to': [0,21],
        'max-items':11,
        item: {
          'font-size':10
        }
      },
      'scale-y': {
        values: "0:400:200",
        item: {
          'font-size':10
        }
      },
      plotarea: {
        margin: "dynamic"
      },
      series: [
        { values: [ /* Omitted for brevity.*/ ]},
        { values: [ /* Omitted for brevity.*/ ]},
        { values: [ /* Omitted for brevity.*/ ]}
      ]
    }
  ]
}
Examples
Here is a stock and volume chart with shared scrolling.
Note: Using blended scales in a mixed chart is another way to achieve the same shared scrolling effect between two or more charts in a graphset.
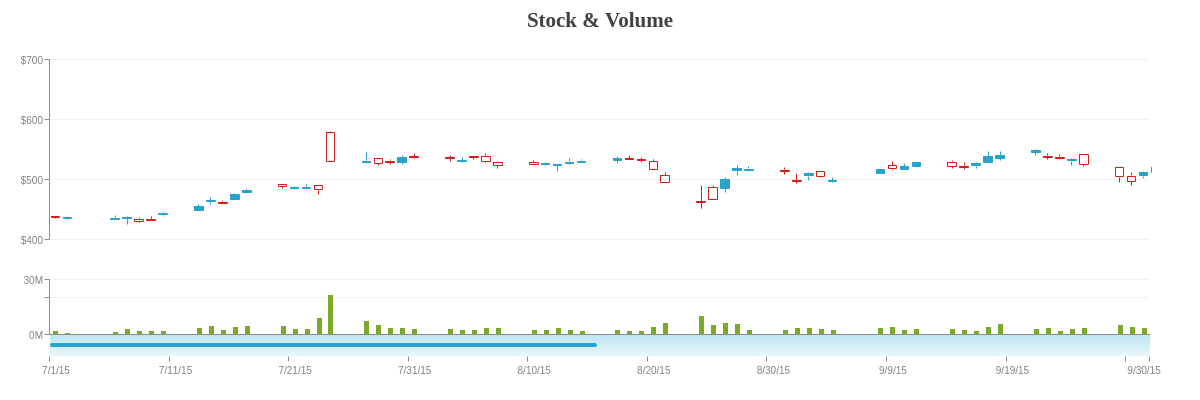
{
  graphset: [
    {
      type: "stock",
      'scale-x': {
        'min-value':1435741200000,
        step: "day",
        transform: {
          type: "date",
          all: "%m/%d/%y"
        },
        item: {
          'font-size':10
        },
        visible: false,
        zooming: true
      },
      zoom: {
        shared: true,
        'background-color': "#29A2CC"
      },
      'scale-y': {
        values: "400:700:100",
        format: "$%v",
        item: {
          'font-size':10
        },
        guide: {
          'line-style': "dotted"
        }
      },
      title: {
        text: "Stock & Volume",
        'font-family': "Georgia"
      },
      height: "65%",
      width: "100%",
      x: "0%",
      y: "0%",
      plot: {
        aspect: "candlestick",
        tooltip: {
          visible: false
        },
        'trend-up': {
          'background-color': "#29A2CC",
          'border-color': "#29A2CC",
          'line-color': "#29A2CC"
        },
        'trend-down': {
          'background-color': "none",
          'border-color': "#D31E1E",
          'line-color': "#D31E1E"
        }
      },
      plotarea: {
        'margin-bottom': "dynamic"
      },
      'crosshair-x': {
        shared: true,
        'plot-label': {
          text: "Open: $%v0<br>High: $%v1<br>Low: $%v2<br>Close: $%v3",
          decimals:2,
          multiple: true,
          'background-color': "white",
          alpha:0.8,
          padding: "5%",
          'border-color': "#29A2CC",
          'border-radius': "3px",
        },
        'scale-label': {
          visible: false
        }
      },
      series: [
        {
          values: [
            //Omitted for brevity.
          ]
        }
      ]
    },
    {
      type: 'bar',
      'scale-x': {
        'min-value':1435741200000,
        step: "day",
        transform: {
          type: "date",
          all: "%m/%d/%y"
        },
        item: {
          'font-size':10
        },
        zooming: true,
        'zoom-to-values': [1435741200000,1443603600000]
      },
      zoom: {
        shared: true,
        'background-color': "#7CA82B"
      },
      'scroll-x': {
        bar: {
          'background-color': "#7ecde7 #d4eef7",
          alpha:0.5,
          height: "15%"
        },
        handle: {
          'background-color': "#29A2CC",
          height: "3%"
        }
      },
      'scale-y': {
        values: "0:30:10",
        format: "%vM",
        item: {
          'font-size':10
        },
        guide: {
          'line-style': "dotted"
        }
      },
      height: "35%",
      width: "100%",
      x: "0%",
      y: "65%",
      plot: {
        'bar-width': "50%",
        'background-color': "#7CA82B"
      },
      plotarea: {
        'margin-top': "dynamic"
      },
      'crosshair-x': {
        shared: true,
        'plot-label': {
          text: "Volume: %vM",
          decimals:2,
          multiple: true,
          'background-color': "white",
          alpha:0.8,
          padding: "5%",
          'border-color': "#7CA82B",
          'border-radius': "3px",
        },
        'scale-label': {
          'font-color': "gray",
          'background-color': "white",
          'border-width': 1,
          'border-color': "gray",
          'border-radius': "3px"
        }
      },
      series: [
        {
          values: [
            //Omitted for brevity.
          ]
        }
      ]
    }
  ]
}
Summary
Have questions about how shared chart interactions work? We're happy to help! Email support@zingchart.com or start a chat right here on this page for support.