Error Bars
Overview
Chart error bars are used on a chart or graph to indicate error or uncertainty about one or more data points. They can represent information such as standard errors, confidence intervals, standard deviation, and more. In ZingChart, the error bar values are specified in an errors array. The error bars can then be styled inside an error object, and the values can be displayed by using tokens with the tooltips, crosshairs, or value boxes.
Errors Array
Use the errors array to specify the error bar values. The number of error bars should match the number of node values it is being applied to. Create an array for each error bar, where you can provide one (both upper and lower) or two (upper and lower, respectively) values. The below code block illustrates the different ways the error bar values can be formatted (numbers, percentages, null values).
errors: [
  [3,4],
  [5],
  [ "3%", "4%" ],
  [ "5%" ],
  [null,1.2],
  [ "1.2%",null],
]
Plot Object
For global application, place the errors array inside the plot object. This placement is best when you have a single dataset or want the same error bar values to be applied across multiple datasets.
Note: Use the hover-state objects in the error and plot objects to turn off the hover visibility of the error bars and nodes, respectively.
{
  type: 'bar',
  plot: {
    errors: [
      [3,4],
      [3.1,3.5],
      [3.4,3.1],
      [2.9,3.3],
      [4,3],
      [4.1,3.9],
      [2.9,3.3],
      [3.6,3.7],
      [3.5,3.5]
    ],
    error: {
      'hover-state': {
        visible: false
      }
    },
    'hover-state': {
      visible: false
    }
  },
  series: [
    {
      values: [34,95,25,15,28,55,59,13,14]
    }
  ]
}
Series Objects
For local application, place the errors array inside the applicable series object(s). This placement is best when you have multiple datasets and want unique error bar values assigned to each data point, or node.
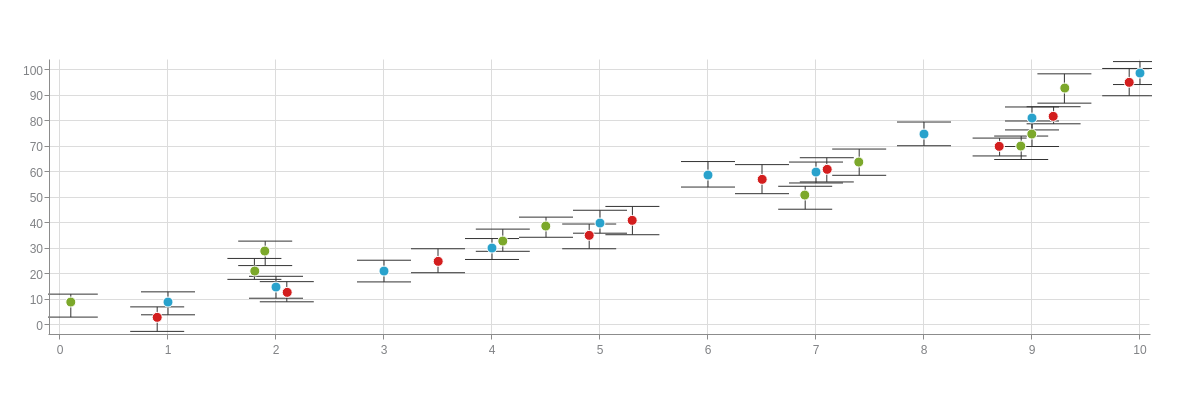
{
  type: "scatter",
  plot: {
    error: {

    }
  },
  series: [
    {
      values: [
        [1,9],
        [2,15],
        [3,21],
        [4,30],
        [5,40],
        [6,59],
        [7,60],
        [8,75],
        [9,81],
        [10,99]
      ],
      errors: [
        [4,5],
        [4.1,4.5],
        [4.4,4.1],
        [3.9,4.3],
        [5,4],
        [5.1,4.9],
        [3.9,4.3],
        [4.6,4.7],
        [4.5,4.5],
        [4.3,4.7]
      ]
    },
    {
      values: [
        [0.9,3],
        [2.1,13],
        [3.5,25],
        [4.9,35],
        [5.3,41],
        [6.5,57],
        [7.1,61],
        [8.7,70],
        [9.2,82],
        [9.9,95]
      ],
      errors: [
        [4.1,5.5],
        [4,3.9],
        [4.9,4.5],
        [4.6,5.1],
        [5.5,5.6],
        [5.9,5.5],
        [4.6,4.9],
        [3.3,3.7],
        [3.6,3.1],
        [5.6,5.1]
      ]
    },
    {
      values: [
        [0.1,9],
        [1.8,21],
        [1.9,29],
        [4.1,33],
        [4.5,39],
        [6.9,51],
        [7.4,64],
        [8.9,70],
        [9,75],
        [9.3,93]
      ],
      errors: [
        [3.1,5.9],
        [5.1,3.1],
        [3.9,5.7],
        [4.6,4.1],
        [3.3,4.6],
        [3.4,5.6],
        [5,5.3],
        [4.1,5.1],
        [5,4,3.5],
        [5.5,6]
      ]
    }
  ]
}
Error Bar Styling
Use the error object in the plot/series object(s) to style the error bars. You can specify the error bar size, customize the line color/width/style, and more. Refer to the Error Bar JSON Attributes/Syntax page for a full list of styling attributes.
In the below line chart, the error bars were styled to decrease the size and customize the line color and width.
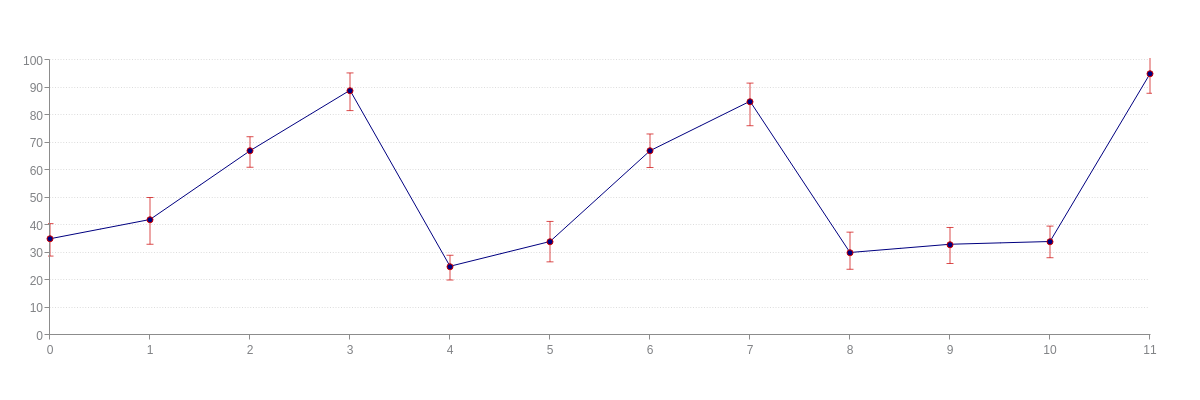
{
  type: "line",
  plot: {
    errors: [
      [5.5,6.3],
      [8,9],
      [5.1,6],
      [6.3,7.4],
      [4,5],
      [7.3,7.4],
      [6.1,6.1],
      [6.6,8.9],
      [7.4,6.1],
      [6.1,7],
      [5.6,5.9],
      [6.3,7.1]
    ],
    error: {
      size: "7px",
      'line-color': "#cc0000",
      'line-width':1,
      alpha:0.7
    },
    'line-color': "#000080",
    'line-width':1,
    marker: {
      size:3,
      'background-color': "#000080",
      'border-color': "#cc0000"
    }
  },
  'scale-y': {
    guide: {
      'line-style': "dotted"
    }
  },
  series: [
    {
      values: [35,42,67,89,25,34,67,85,30,33,34,95]
    }
  ]
}
In the below area chart, the sizing and line styling of the error bars was adjusted.
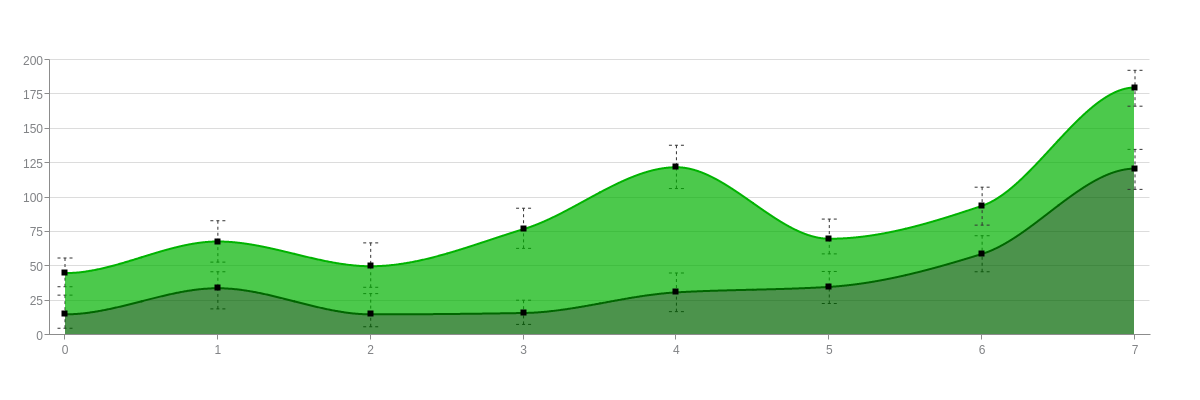
{
  type: "area",
  plot: {
    error: {
      size: "15px",
      'line-width':1,
      'line-segment-size':3,
      'line-gap-size':3
    },
    aspect: "spline",
    stacked: true,
    'alpha-area':0.7,
    marker: {
      type: "square",
      size:3,
      'background-color': "black",
      'border-color': "none"
    }
  },
  'scale-x': {
    'offset-start':15,
    'offset-end':15
  },
  'scale-y': {
    values: "0:200:25",
    guide: {
      'line-style': "solid"
    }
  },
  series: [
    {
      values: [15,34,15,16,31,35,59,121],
      'line-color': "#006600",
      'background-color': "#006600",
      errors: [
        [14,10.1],
        [12,15],
        [15.1,9],
        [9.3,8.3],
        [14.1,14],
        [11.2,12.1],
        [13.2,13],
        [14,15.1],
      ]
    },
    {
      values: [30,34,35,61,91,35,35,59],
      'line-color': "#00b300",
      'background-color': "#00b300",
      errors: [
        [11,9.9],
        [15.1,15],
        [17,15.3],
        [15.2,14],
        [16,15.5],
        [14.3,11],
        [13.5,14.1],
        [12.5,13.6],
      ]
    }
  ]
}
Error Bar Labeling
You may want to display the error bar values, whether it is through labels that appear when users hover over the data points (tooltips or crosshairs) or fixed labels that appear on the actual chart (value boxes).
Tokens
The following tokens can be used to display the error bar values. They can be combined with other tokens (see our ZingChart Tokens Tutorial for a comprehensive list) and used with tooltips, crosshairs, and value boxes.
| Token | Description |
|---|---|
| %node-error-minus | The value of the negative error. |
| %node-error-plus | The value of the positive error. |
Tooltips
In the below scatter plot, the error bar values appear in the tooltips. For more on tooltip customization and styling, read the Tooltips Tutorial.
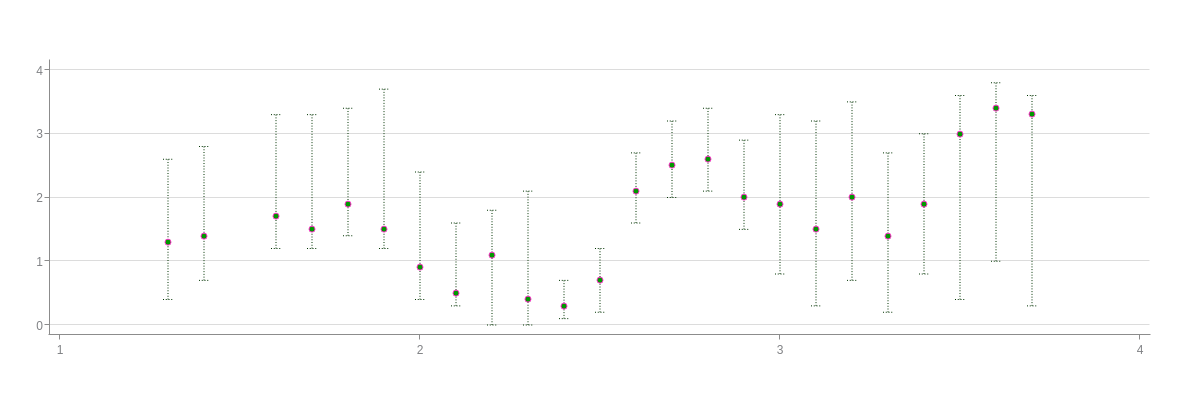
{
  type: "scatter",
  plot: {
    tooltip: {
      text: "%v<br>+%node-error-plus/-%node-error-minus",
      'font-color': "#003300",
      'font-family': "Georgia",
      'background-color': "white",
      'border-color': "#003300",
      'border-width': 1,
      'border-radius': "5px",
      alpha:0.5,
      padding: "5%",
      callout: true
    },
    errors: [
      [1.3,0.9],
      [1.4,0.7],
      [1.6,0.5],
      [1.8,0.3],
      [1.5,0.5],
      [2.2,0.3],
      [1.5,0.5],
      [1.1,0.2],
      [0.7,1.1],
      [1.7,0.4],
      [0.4,0.2],
      [0.5,0.5],
      [0.6,0.5],
      [0.7,0.5],
      [0.8,0.5],
      [0.9,0.5],
      [1.4,1.1],
      [1.7,1.2],
      [1.5,1.3],
      [1.3,1.2],
      [1.1,1.1],
      [0.6,2.6],
      [0.4,2.4],
      [0.3,3]
    ],
    error: {
      size: "10px",
      'line-color': "#003300",
      'line-width':1,
      'line-style': "dotted"
    },
    marker: {
      size:3,
      'background-color': "#009900",
      'border-width': 1,
      'border-color': "#ff33cc"
    },
    'hover-marker': {
      visible: false
    }
  },
  'scale-x': {
    guide: {
      visible: false
    }
  },
  'scale-y': {
    guide: {
      'line-style': "solid",

    }
  },
  series: [
    {
      values: [
        [1.3,1.3],
        [1.4,1.4],
        [1.6,1.7],
        [1.7,1.5],
        [1.8,1.9],
        [1.9,1.5],
        [2,0.9],
        [2.1,0.5],
        [2.2,1.1],
        [2.3,0.4],
        [2.4,0.3],
        [2.5,0.7],
        [2.6,2.1],
        [2.7,2.5],
        [2.8,2.6],
        [2.9,2],
        [3,1.9],
        [3.1,1.5],
        [3.2,2],
        [3.3,1.4],
        [3.4,1.9],
        [3.5,3],
        [3.6,3.4],
        [3.7,3.3]
      ]
    }
  ]
}
Crosshairs
In the below line chart, the error bar values appear in the crosshairs. For more on crosshair customization and styling, read the Crosshairs Tutorial.
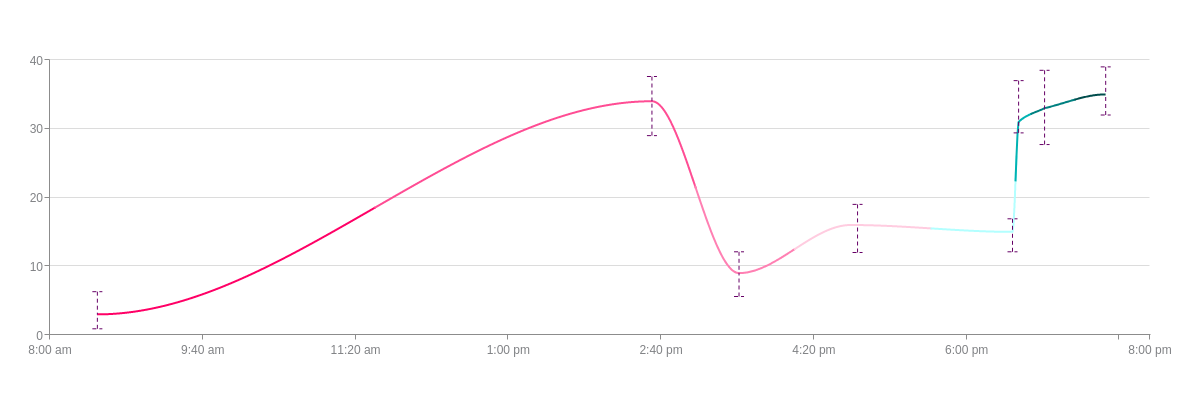
{
  type: "line",
  'crosshair-x': {
    'plot-label': {
      text: "%v<br>+%node-error-plus/-%node-error-minus",
      'text-align': "center",
      'font-color': "#660066",
      'font-family': "Georgia",
      'background-color': "#ffe6f0",
      alpha:0.7,
      'border-color': "none",
      'border-radius': "5px",
      padding: "10%",
    },
    'scale-label': {
      text: "%v",
      transform: {
        type: "date",
        all: "%M %d, %Y<br>%g:%i %a"
      },
      'font-family': "Georgia"
    }
  },
  plot: {
    errors: [
      [3.3,2.1],
      [3.6,5],
      [3.1,3.4],
      [3,4],
      [1.9,2.9],
      [6,1.6],
      [5.5,5.3],
      [4,3]
    ],
    error: {
      size: "10px",
      'line-color': "#660066",
      'line-style': "dashed"
    },
    tooltip: {
      visible: false
    },
    aspect: "spline",
    styles: [ "#ff0066", "#ff4d94", "#ff80b3", "#ffcce0", "#b3ffff", "#00b3b3", "#008080", "#004d4d" ],
    marker: {
      visible: false
    }
  },
  'scale-x': {
    'min-value': "1459515600000",
    'max-value': "1459558800000",
      transform: {
        type: "date",
        all: "%g:%i %a"
      },
      'max-items':6
  },
  utc: true,
  timezone:-5, //EST time
  'scale-y': {
    guide: {
      'line-style': "solid"
    }
  },
  series: [
    {
      values: [
        [1459517460000,3],
        [1459539240000,34],
        [1459542660000,9],
        [1459547040000,16],
        [1459553400000,15],
        [1459553640000,31],
        [1459554660000,33],
        [1459557060000,35]
      ]
    }
  ]
}
Value Boxes
In the below bar chart, the error bar values are displayed in the value boxes. For more on value box customization and styling, read the Value Box Tutorial.
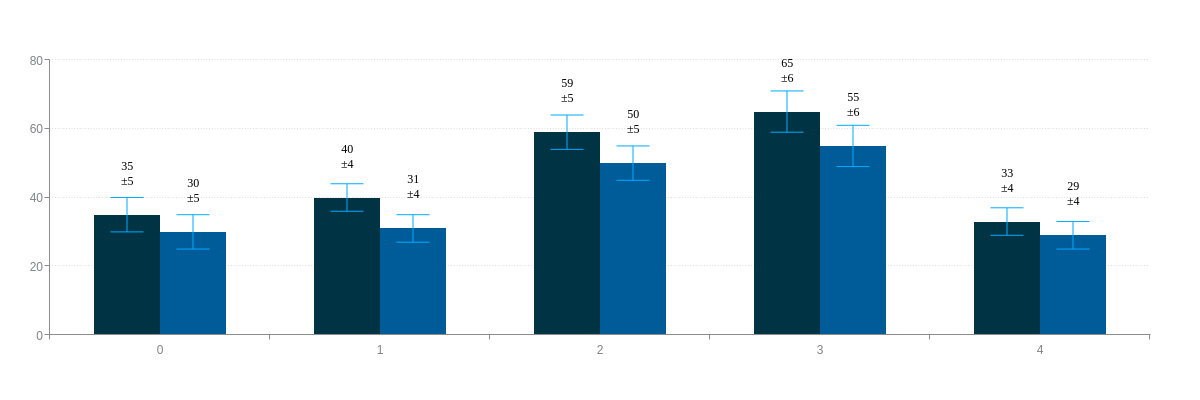
{
  type: 'bar',
  plot: {
    'value-box': {
      text: "%v<br>±%node-error-plus",
      'font-family': "Times New Roman",
      'font-color': "black",
      'font-weight': "normal",
      'font-size':12,
      placement: "top",
      'offset-y': "-20px",
    },
    errors: [
      [5],
      [4],
      [5],
      [6],
      [4],
    ],
    error: {
      'line-color': "#00aaff",
      'line-width':1,
      'hover-state': {
        visible: false
      }
    },
    'bar-space':0,
    'bars-space-left': "20%",
    'bars-space-right': "20%",
    'hover-state': {
      visible: false
    }
  },
  'scale-y': {
    values: "0:80:20",
    guide: {
      'line-style': "dotted"
    }
  },
  series: [
    {
      values: [35,40,59,65,33],
      'background-color': "#003344"
    },
    {
      values: [30,31,50,55,29],
      'background-color': "#005c99"
    }
  ]
}
Summary
Have questions about how error bars work? We're happy to help! Email support@zingchart.com or start a chat right here on this page for support.