Tokens
Overview
ZingChart tokens act as variables for different value types. Known as string interpolation or variable substitution, the token will return the applicable value when it is called. This tutorial organizes the tokens according to whether they're tied to the:
- Nodes
- Scales
- Time-Series
- Other (legend tooltips, standalone labels)
The majority of the tokens are tied to the nodes (or data points), and can be used with tooltips, value boxes, crosshair plot labels, and rules. There are also tokens tied to the scales, which can be used with the x- and y-axis scales, crosshair scale labels, and scale tooltips. With time-series data, tokens are used to specify how the Unix timestamps are formatted. There are also a limited number of tokens that can be used with legends and standalone labels.
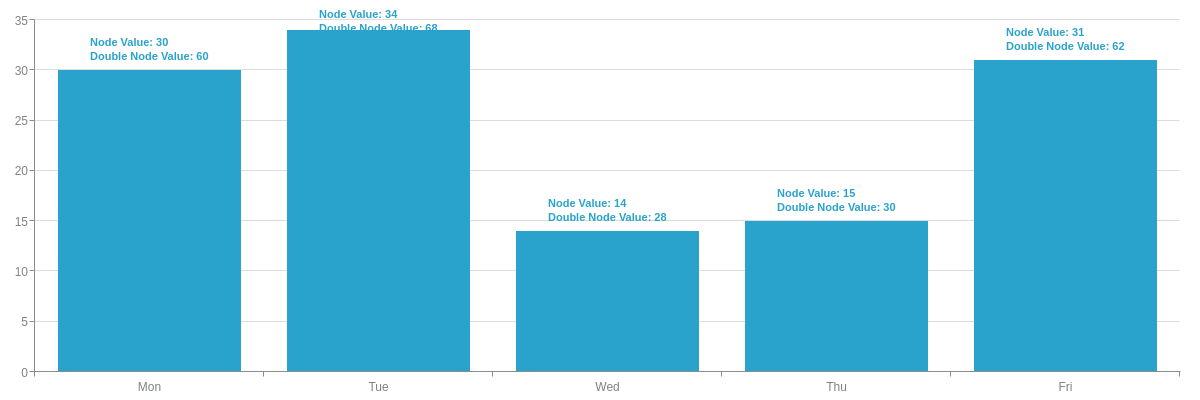
Math Operations
ZingChart supports basic math operations with evaluated tokens. Just place your math expression containing token(s) within two curly brackets. Any constructs between the brackets will be evaluated after all tokens have been parsed.
valueBox: {
  text: 'Double the value: {{ %v * 2 }}'
}
Tokens List
Here is a full list of currently available tokens, provided in alphabetical order.
Note: Time-series tokens have their own list in the Time-Series section below.
| Token | Description |
|---|---|
| '%chart-height' | The chart's height. Demo |
| '%chart-width' | The chart's width. Demo |
| '%data-' | Format for custom tokens. The custom token is defined in the plot or series object as an attribute or array using the "data" prefix, e.g., data-fullname or data-extracredit. It is then recalled in the tooltips, value boxes, or crosshair plot labels, e.g., %data-fullname or %data-extracredit Introduced in: v1.1.0 Demo |
| '%graphid' | The id# string of the chart in a graphset. Demo |
| '%hits' | The number of times that the word occurs in the cloud. Chart types: Wordcloud Demo |
| '%id' | The dom ID of the chart. Demo |
| '%joined-value' | The joined value between two sets. Chart types: Venn-diagram Demo |
| '%node-count' '%N' | The total number of nodes (or data points) in the plot. Demo |
| '%node-error-minus' | Error Bars only: the value of the negative error. Refer to the Error Bars Tutorial for more information. Demo |
| '%node-error-plus' | Error Bars only: the value of the positive error. Refer to the Error Bars Tutorial for more information. Demo |
| '%node-goal-value' '%g' | The goal node value Chart types: Bullet Demo |
| '%node-index' '%i' '%n' | The index number of the current node. Demo |
| '%node-percent-value' '%npv' | Funnel and Pie Charts only: the percentage of the current node value relative to the sum of all nodes. Introduced in: v2.3.3 Demo |
| '%node-value' '%v' | Node value. Demo |
| '%node-value-stock-close' '%close' '%v3' | The closing (OHLC) node value. Introduced in: v2.3.0 Chart types: Stock Demo |
| '%node-value-stock-high' '%high' '%v1' | The highest (OHLC) node value. Introduced in: v2.3.0 Chart types: Stock Demo |
| '%node-value-stock-low' '%low' '%v2' | The lowest (OHLC) node value. Introduced in: v2.3.0 Chart types: Stock Demo |
| '%node-value-stock-open' '%open' '%v0' | The opening (OHLC) node value. Introduced in: v2.3.0 Chart types: Stock Demo |
| '%node-x' | The x-coordinate pixel position, relative to the top-left corner of the chart. Introduced in: v2.6.0 Demo |
| '%node-y' | The y-coordinate pixel position, relative to the top-left corner of the chart. Introduced in: v2.6.0 Demo |
| '%offset-values' | The offset value at a specific node. Introduced in: v2.5.1 Demo |
| '%output-percent-value' | The percentage of the current node value relative to the previous node value. Chart types: Funnel Demo |
| '%paired-node-value' | The value of the next set. With Set 1, its pair is 2; with Set 2, its pair is 3; and with Set 3, its pair is 1. Refer to the Venn Diagram Tutorial for more information. Chart types: Venn-diagram Demo |
| '%paired-plot-text' | The text of the next set. With Set 1, its pair is 2; with Set 2, its pair is 3; and with Set 3, its pair is 1. Refer to the Venn Diagram Tutorial for more information. Chart types: Venn-diagram Demo |
| '%pie-total-value' | The sum of all the pie slice values. Introduced in: v2.5.0 Chart types: Pie Demo |
| '%plot-#-value' | Standalone Labels only: the node value of a specified plot, provided in the following format: %plot-plot number-value, e.g., %plot-0-value. Note that plot numbering begins at zero. Introduced in: v2.9.1 Demo |
| '%plot-average' '%pavg' | The average value of the nodes in the current plot. Demo |
| '%plot-count' '%P' | The total number of plots (or datasets). Demo |
| '%plot-description' | The description of the current plot, pulled from the description attribute in the plot/series object. Introduced in: v1.1.0 Demo |
| '%plot-index' '%p' | The index number of the current plot. Demo |
| '%plot-max-index' '%pxi' | The highest node index number in the current plot. Demo |
| '%plot-max-value' '%pxv' | The highest node value in the current plot. Demo |
| '%plot-min-index' '%pmi' | The lowest node index number in the current plot. Demo |
| '%plot-min-value' '%pmv' | The lowest node value in the current plot. Demo |
| '%plot-percent' '%pper' | The percentage value of the node, relative to the sum of all nodes in that plot. Remember to use the decimals attribute to specify the number of decimal places displayed. Demo |
| '%plot-sum' '%psum' | The sum of the node values in the current plot. Demo |
| '%plot-text' '%t' | The text of the current plot, pulled from the text attribute in the plot/series object. Demo |
| '%plot-text-#' '%t#' | The text of a specified plot, pulled from the text attribute in the plot/series object. Demo |
| '%plot-values' '%pv' | A list of all the node values in the current plot. Demo |
| '%scale-index' '%scale-position' '%i' '%c' | Displays the scale-x or scale-y index. Only works on objects directly associated to a scale. Demo |
| '%scale-key-label' '%kl' | Displays the x-axis scale label, pulled from the labels array in the scale-x object. If no labels, the token defaults to display the unparsed value. Demo |
| '%scale-key-label-#' '%kl#' | Displays the x-axis scale label for a specific node, pulled from the labels array in the scale-x object. If no labels, the token defaults to display the unparsed value. Demo |
| '%scale-key-text' '%kt' | Displays the parsed x-axis scale value. If no values, the token defaults to display parsed label data. Introduced in: v2.7.1 Demo |
| '%scale-key-text-#' '%kt#' | Displays the parsed x-axis scale value for a specific node. If no values, the token defaults to display parsed label data. Introduced in: v2.7.1 Demo |
| '%scale-key-value' '%kv' '%k' | Displays the parsed (formatted, transformed) x-axis scale value. Ignores labels. Introduced in: v2.7.1 Demo |
| '%scale-key-value-#' '%kv#' '%k#' | Displays the parsed (formatted, transformed) x-axis scale value for a specific node. Ignores labels. Introduced in: v2.7.1 Demo |
| '%scale-label' '%l' '%t' | Displays the scale-x or scale-y text label. This can be different than the scale values, especially for scale-x. |
| '%scale-value-label' '%vl' | Displays the y-axis scale label, pulled from the labels array in the scale-y object. Introduced in: v2.3.0 Demo |
| '%scale-value-text' '%vt' | Displays the unparsed y-axis scale value. Introduced in: v2.3.0 Demo |
| '%scale-value-value' '%vv' | Displays the parsed (i.e., formatted, transformed) y-axis scale value. Ignores labels. Introduced in: v2.3.0 Demo |
| '%shared-value' | The shared value between three sets. Refer to the Venn Diagram Tutorial for more information. Chart types: Venn-diagram Demo |
| '%stack-average' | The average value of stacked bars. Introduced in: v2.6.0 Chart types: Bar Demo |
| '%stack-length' | The number of stacked bars. Introduced in: v2.6.0 Chart types: Bar Demo |
| '%stack-total' | The total value of stacked bars. Introduced in: v2.5.2 Chart types: Bar Demo |
| '%text' | Displays the `text` value of the selected node. Chart types: Treemap,Wordcloud Demo |
| '%total' | Stacked Charts only: the total value of the current stack. Demo |
| '%v0' | The x value of the bubble. Chart types: Bubble Demo |
| '%v1' | The y value of the bubble. Chart types: Bubble Demo |
| '%v2' '%node-size-value' | The size of the bubble. Chart types: Bubble Demo |
| '%value-aspect' | Displays the value used to adjust the aspect of the box (alpha, red/green/blue intensity). Chart types: Treemap Demo |
| '%value-size' '%value' | Displays the value of the box. Chart types: Treemap Demo |
Nodes
Most of our tokens are tied to the node value, or the data points that make up your chart. Node tokens can be used with tooltips, value boxes, crosshair plot labels, and rules, as the following chart examples using the %v token (representing the node value) demonstrate.
Note: Because time-series tokens overlap with nodes and scales, they are discussed in their own Time-Series section below.
Tooltips
Tooltips are the labels that appear when you hover over the node values, and they appear by default across our charting library.
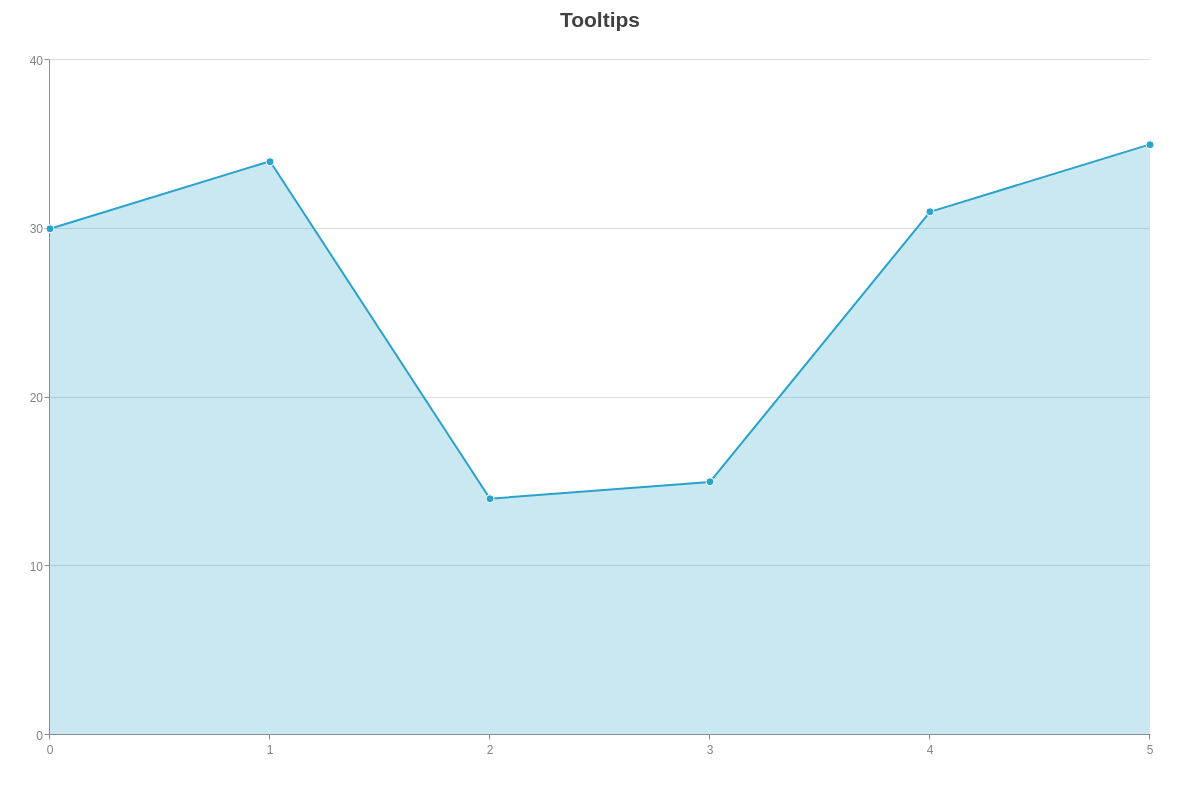
{
  type: "area",
  title: {
    text: "Tooltips"
  },
  plot: {
    tooltip: {
      text: "Node Value: %v"
    }
  },
  series: [{
    values: [30, 34, 14, 15, 31, 35]
  }]
}
Value Boxes
Value boxes are fixed labels that appear on or around the node values. They can be used to emphasize or draw attention to specific data points.
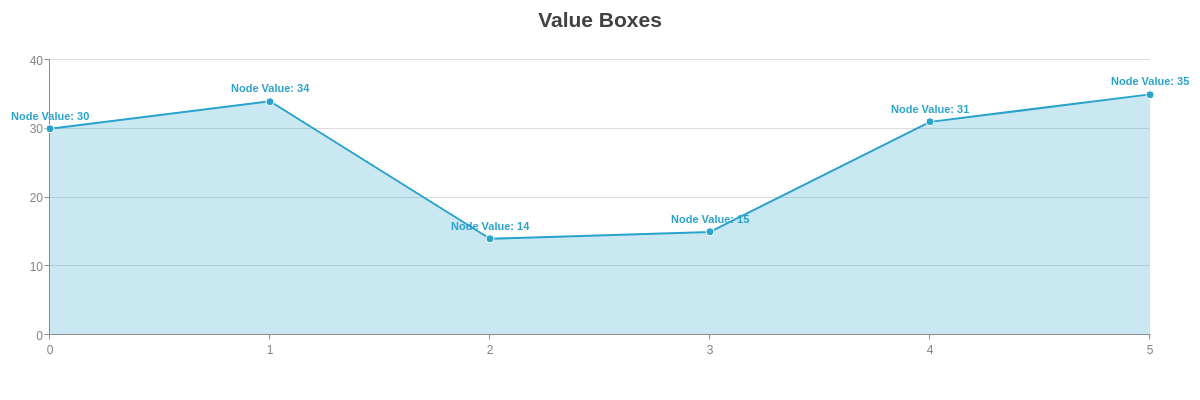
{
  type: "area",
  title: {
    text: "Value Boxes"
  },
  plot: {
    'value-box': {
      text: "Node Value: %v"
    },
    tooltip: {
      visible: false
    }
  },
  series: [{
    values: [30, 34, 14, 15, 31, 35]
  }]
}
Crosshair Plot Labels
Crosshairs are another type of hover label with two parts: the plot label (upper label) and the scale label (lower label). The plot label portion (shown in the below example) is tied to the nodes. The scale label portion (see the Crosshair Scale Labels section further below) is tied to the scales.
Note: To emphasize the plot labels, the visibility of the scale labels was turned off in the below example.
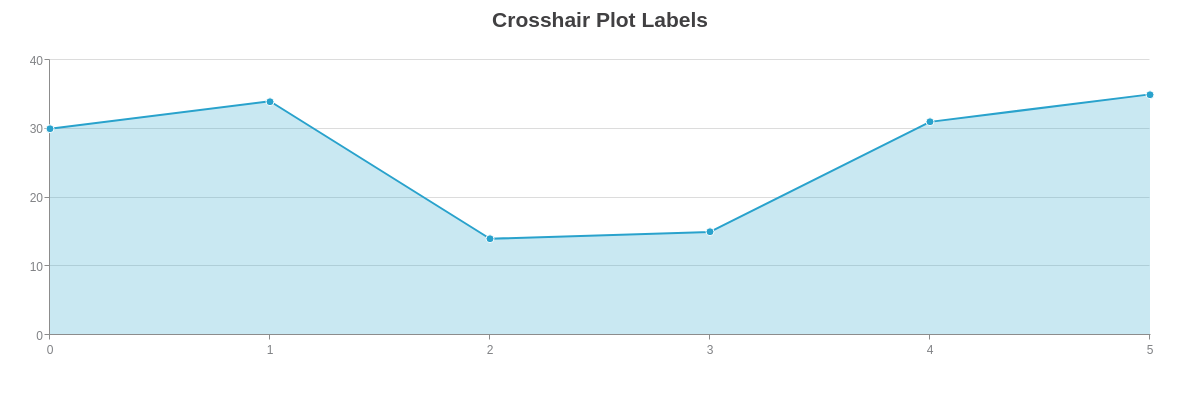
{
  type: "area",
  title: {
    text: "Crosshair Plot Labels"
  },
  'crosshair-x': {
    'plot-label': {
      text: "Node Value: %v"
    },
    'scale-label': {
      visible: false
    }
  },
  plot: {
    tooltip: {
      visible: false
    }
  },
  series: [{
    values: [30, 34, 14, 15, 31, 35]
  }]
}
Rules
Rules allow you to customize the appearance of your chart based on specified conditions. In the following chart, rules were used to define the line, background, and marker colors based on the node value. See the Logic Rules Tutorial for more information.
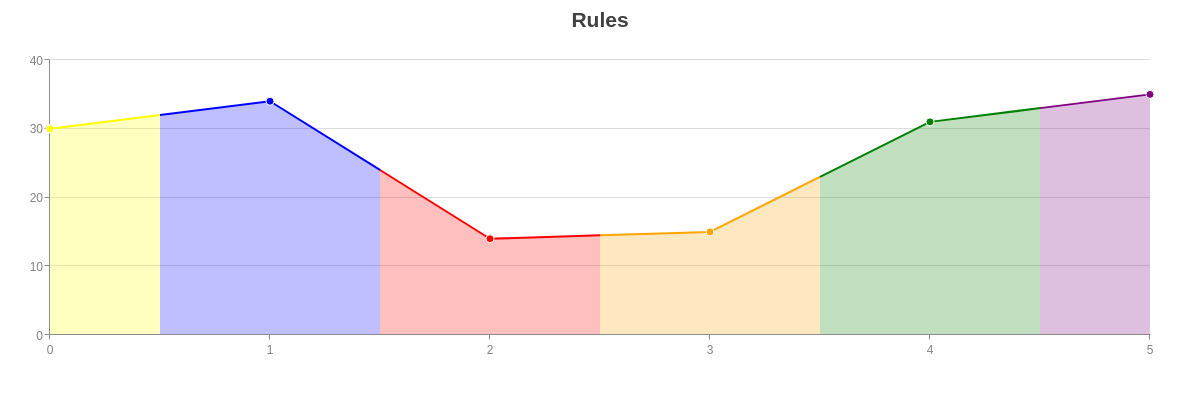
{
  type: "area",
  title: {
    text: "Rules"
  },
  plot: {
    rules: [{
      rule: "%v <=35 && %v > 34",
      'line-color': "purple",
      'background-color': "purple"
    }, {
      rule: "%v <=34 && %v > 31",
      'line-color': "blue",
      'background-color': "blue"
    }, {
      rule: "%v <= 31 && %v > 30",
      'line-color': "green",
      'background-color': "green"
    }, {
      rule: "%v <= 30 && %v > 25",
      'line-color': "yellow",
      'background-color': "yellow"
    }, {
      rule: "%v <= 25 && %v > 14.5",
      'line-color': "orange",
      'background-color': "orange"
    }, {
      rule: "%v <= 14.5",
      'line-color': "red",
      'background-color': "red"
    }],
    marker: {
      rules: [{
        rule: "%v <=35 && %v > 34",
        'background-color': "purple"
      }, {
        rule: "%v <=34 && %v > 31",
        'background-color': "blue"
      }, {
        rule: "%v <= 31 && %v > 30",
        'background-color': "green"
      }, {
        rule: "%v <= 30 && %v > 25",
        'background-color': "yellow"
      }, {
        rule: "%v <= 25 && %v > 14.5",
        'background-color': "orange"
      }, {
        rule: "%v <= 14.5",
        'background-color': "red"
      }]
    }
  },
  series: [{
    values: [30, 34, 14, 15, 31, 35]
  }]
}
Scales
Scales are distinct from nodes, and they use their own %v token (corresponding to the scale value). The scale value token (%v) is distinct from the node value token (%v), despite sharing the same name. The scale value token is used specifically for scale-related items, and can be used with the x-axis scale, y-axis scale, crosshair scale labels, and scale tooltips, as the following chart examples demonstrate. Refer to the Configuring the X/Y-Axis Scales Tutorial for more information on the different scale types (linear, logarithmic, category, time-series).
Note: Because time-series tokens overlap with scales and nodes, they are discussed in a separate Time-Series section below.
X-Axis Scale
You can format the appearance of the scale values by using the format attribute and %v scale value token in the scale-x object. Refer to the Scales Tutorial for more information and examples as how you format the scale labels will often depend on the type of scale used (linear, time-series, category).
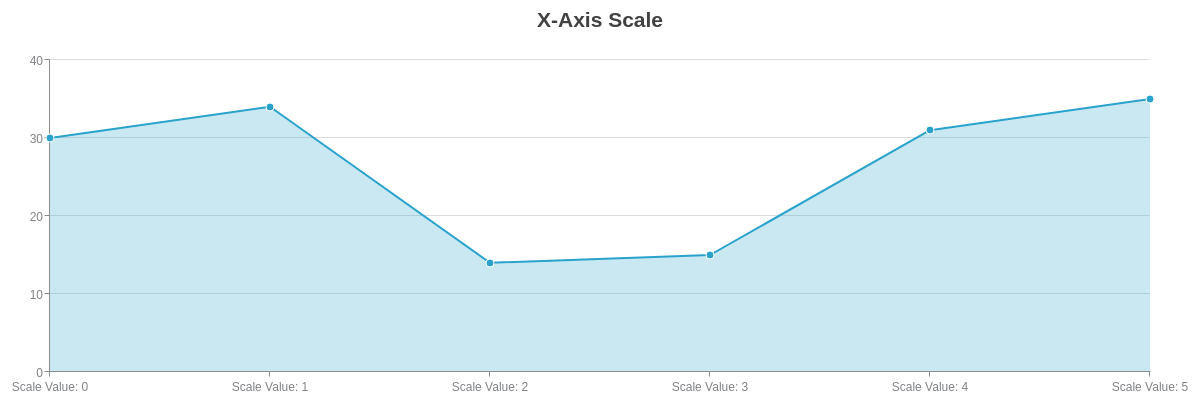
{
  type: "area",
  title: {
    text: "X-Axis Scale"
  },
  'scale-x': {
    format: "Scale Value: %v"
  },
  plotarea: {
    'margin-bottom': "dynamic"
  },
  series: [{
    values: [30, 34, 14, 15, 31, 35]
  }]
}
Y-Axis Scale
Use the format attribute and %v scale value token in the scale-y object to format the appearance of the scale values. See the Scales Tutorial for more information and examples as how you format the scale labels will often depend on the type of scale used (linear, logarithmic, category).
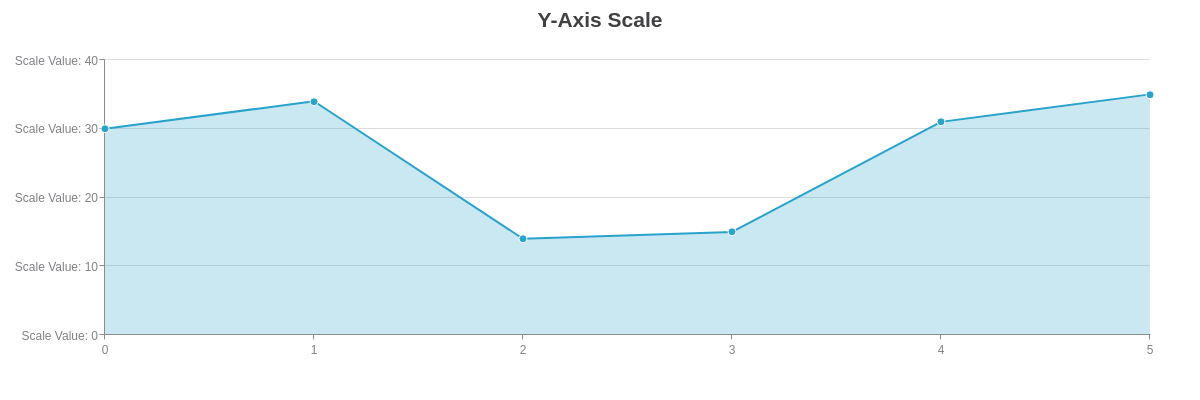
{
  type: "area",
  title: {
    text: "Y-Axis Scale"
  },
  'scale-y': {
    format: "Scale Value: %v"
  },
  plotarea: {
    'margin-left': "dynamic"
  },
  series: [{
    values: [30, 34, 14, 15, 31, 35]
  }]
}
Crosshair Scale Labels
Crosshairs are another type of hover label with two parts: the plot label (upper label) and the scale label (lower label). The scale label portion (shown in the below example) is tied to the scale. The plot label portion (see the Crosshair Plot Labels section further above) is tied to the node.
Note: To emphasize the scale labels, the visibility of the plot labels was turned off in the below example.

{
  type: "area",
  title: {
    text: "Crosshair Scale Labels"
  },
  'crosshair-x': {
    'plot-label': {
      visible: false
    },
    'scale-label': {
      text: "Scale Value: %v"
    }
  },
  plot: {
    tooltip: {
      visible: false
    }
  },
  series: [{
    values: [30, 34, 14, 15, 31, 35]
  }]
}
Scale Tooltips
Scale tooltips appear when you hover over the labels on the x- and/or y-axis. Note that the tooltip object with text attribute must be added to each scale object you want the tooltips to appear for.
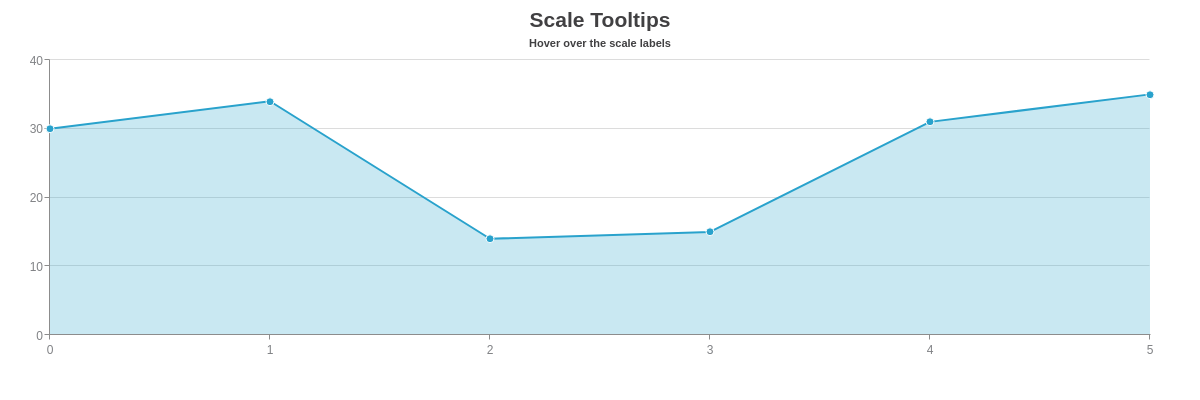
{
  type: "area",
  title: {
    text: "Scale Tooltips"
  },
  subtitle: {
    text: "Hover over the scale labels"
  },
  'scale-x': {
    tooltip: {
      text: "Scale Value: %v"
    }
  },
  'scale-y': {
    tooltip: {
      text: "Scale Value: %v"
    }
  },
  series: [
    {
      values: [30,34,14,15,31,35]
    }
  ]
}
Time-Series
ZingChart accepts Unix time values in milliseconds, which are then converted into a readable format on your chart. Our time-series tokens were created for the specific purpose of formatting that time-series data. That formatting is done inside a transformobject. In the object, you must add a type attribute with the value set to date. You must also add an all attribute. The value will be the time-series tokens and/or alphanumeric characters you want displayed. Time-series tokens can be used with the x-axis scale, y-axis scale, tooltips, value boxes, and crosshairs (both plot and scale labels).
Tokens List
Here is a full list of currently available time-series tokens, provided in alphabetical order.
| Token | Description |
|---|---|
%A |
Displays the ante or post meridiem time in upper case letters: AM or PM. |
%a |
Displays the ante or post meridiem time in lower case letters: am or pm. |
%D |
Displays the day of the week in abbreviated form: Sun, Mon, Tue, Wed, Thu, Fri and Sat. |
%d |
Displays the day's date without a leading 0 if the date is single digit. |
%dd |
Displays the day's date with a leading 0 if the date is single digit. |
%G |
Displays the hour in 24-hour format without a leading 0. |
%g |
Displays the hour in 12-hour format without a leading 0. |
%H |
Displays the hour in 24-hour format with a leading 0 if the hour is single digit. |
%h |
Displays the hour in 12-hour format with a leading 0 if the hour is single digit. |
%i |
Displays the minutes. |
%M |
Displays the month in abbreviated form: Jan, Feb, Mar, Apr, May, Jun, Jul, Aug, Sep, Oct, Nov and Dec. |
%m |
Displays the month numerically without a leading 0 if the date is single digit. |
%mm |
Display the month numerically with a leading 0 if the month is single digit. |
%q |
Displays the milliseconds. |
%s |
Displays the seconds. |
%Y |
Displays the year in 4-digit format. |
%y |
Displays the year in 2-digit format. |
X-Axis Scale
Time-series formatting starts with the x-axis scale. In the scale-x object, specify your minimum (min-value) and step (step) scale values. In the transform object, add a type and all attribute. Refer to the Configuring the X/Y-Axis Scales Tutorial for more information.

{
  type: "line",
  title: {
    text: "X-Axis Scale"
  },
  'scale-x': {
    'min-value': "1457101800000",
    'max-value': "1457125200000",
    step: "30minute",
    transform: {
      type: "date",
      all: "%g:%i"
    },
    label: {
      text: "Trading Day"
    },
    item: {
      'font-size': 10
    },
    'max-items': 14
  },
  utc: true,
  timezone: -5, //EST time
  'scale-y': {
    values: "30:34:1",
    format: "$%v",
    label: {
      text: "Price"
    },
    item: {
      'font-size': 10
    },
    guide: {
      'line-style': "solid"
    }
  },
  series: [{
    values: [
      [1457101800000, 30.34], //03/04/2016 at 9:30 a.m. EST (which is 14:30 in GMT)
      [1457103600000, 31.30], //10:00 a.m.
      [1457105400000, 30.95], //10:30 a.m.
      [1457107200000, 30.99], //11:00 a.m.
      [1457109000000, 32.33], //11:30 a.m.
      [1457110800000, 33.34], //12:00 p.m.
      [1457112600000, 33.01], //12:30 p.m.
      [1457114400000, 34], //1:00 p.m.
      [1457116200000, 33.64], //1:30 p.m.
      [1457118000000, 32.59], //2:00 p.m.
      [1457119800000, 32.60], //2:30 p.m.
      [1457121600000, 31.99], //3:00 p.m.
      [1457123400000, 31.14], //3:30 p.m.
      [1457125200000, 32.34], //at 4:00 p.m. EST (which is 21:00 GMT)
    ]
  }]
}
Y-Axis Scale
While less commonly used, you can also create a time-series scale on the y-axis. In the scale-y object, specify your minimum (min-value) and step (step) scale values. In the transform object, add a type and all attribute. Refer to the Configuring the X/Y-Axis Scales Tutorial for more information.
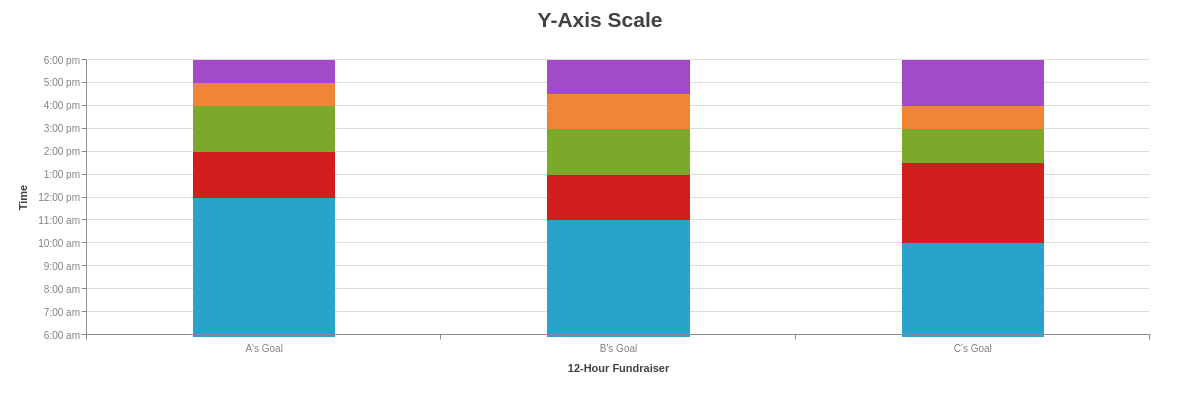
{
  type: 'bar',
  title: {
    text: "Y-Axis Scale"
  },
  plot: {
    'bar-width': "50%",
    stacked: true,
    tooltip: {
      text: "Raise %plot-text by %scale-value-value",
      transform: {
        type: "date",
        all: "%g:%i %A"
      }
    },
  },
  'scale-x': {
    labels: [ "A's Goal", "B's Goal", "C's Goal" ],
    label: {
      text: "12-Hour Fundraiser"
    },
    item: {
      'font-size':10
    },
  },
  'scale-y': {
    'min-value': "1457091000000", //6 AM
    'max-value': "1457132400000", //Midnight
    step: "3600000", //1 hour
    transform: {
      type: "date",
      all: "%g:%i %a"
    },
    label: {
      text: "Time"
    },
    item: {
      'font-size':10
    },
  },
  utc: true,
  timezone:-5, //EST time
  plotarea: {
    'margin-left': "15%"
  },
  series: [
    {
      values: [1457110800000, 1457107200000, 1457103600000],
      text: "300K"
    },
    {
      values: [7200000, 7200000, 12600000],
      text: "350K"
    },
    {
      values: [7200000, 7200000, 5400000],
      text: "400K"
    },
    {
      values: [3600000, 5400000, 3600000],
      text: "450K"
    },
    {
      values: [3600000, 5400000, 7200000],
      text: "500K"
    }
  ]
}
Tooltips
Use the %kv token to display time-series values in the tooltips. You can also change the formatting of that time-series data (e.g., to show the full date or a shortened version of it) by adding a transform object to the tooltip object. Add a type attribute (with value set to date) and all attribute (with desired formatting contained in quotes).
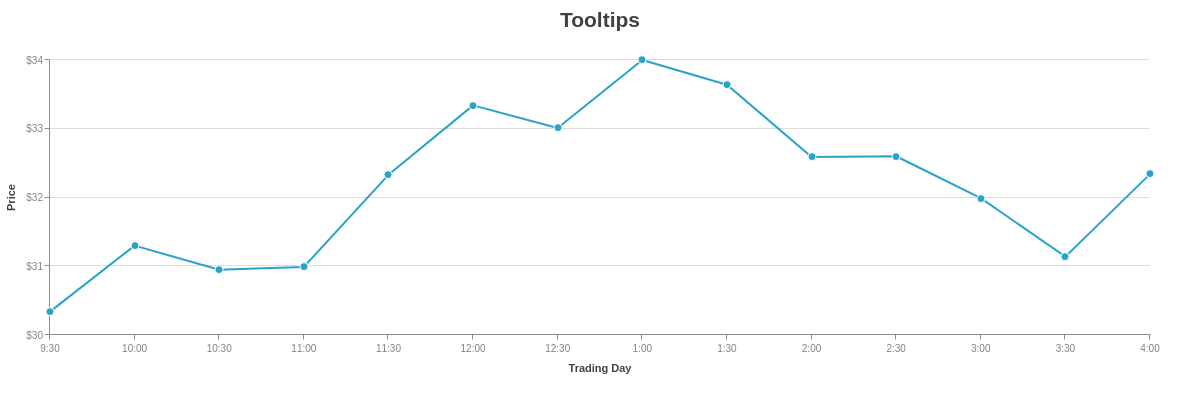
{
  type: "line",
  title: {
    text: "Tooltips"
  },
  plot: {
    tooltip: {
      text: "%kv",
      transform: {
        type: "date",
        all: "%g:%i %a<br>on<br>%M %d, %Y"
      }
    }
  },
  'scale-x': {
    'min-value': "1457101800000",
    'max-value': "1457125200000",
    step: "30minute",
    transform: {
      type: "date",
      all: "%g:%i"
    },
    label: {
      text: "Trading Day"
    },
    item: {
      'font-size': 10
    },
    'max-items': 14
  },
  utc: true,
  timezone: -5, //EST time
  'scale-y': {
    values: "30:34:1",
    format: "$%v",
    label: {
      text: "Price"
    },
    item: {
      'font-size': 10
    },
    guide: {
      'line-style': "solid"
    }
  },
  series: [{
    values: [
      [1457101800000, 30.34], //03/04/2016 at 9:30 a.m. EST (which is 14:30 in GMT)
      [1457103600000, 31.30], //10:00 a.m.
      [1457105400000, 30.95], //10:30 a.m.
      [1457107200000, 30.99], //11:00 a.m.
      [1457109000000, 32.33], //11:30 a.m.
      [1457110800000, 33.34], //12:00 p.m.
      [1457112600000, 33.01], //12:30 p.m.
      [1457114400000, 34], //1:00 p.m.
      [1457116200000, 33.64], //1:30 p.m.
      [1457118000000, 32.59], //2:00 p.m.
      [1457119800000, 32.60], //2:30 p.m.
      [1457121600000, 31.99], //3:00 p.m.
      [1457123400000, 31.14], //3:30 p.m.
      [1457125200000, 32.34], //at 4:00 p.m. EST (which is 21:00 GMT)
    ]
  }]
}
Value Boxes
To display time-series values in the value boxes, use the %kv token. To change the time-series formatting, add a transform object to the value-box object. Make sure to add a type attribute (with value set to date) and all attribute (with desired formatting contained in quotes).
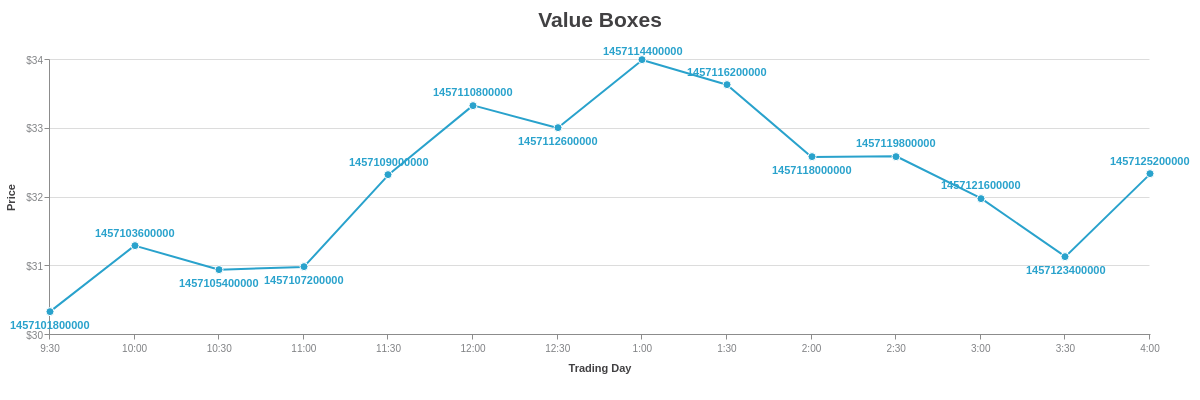
{
  type: "line",
  title: {
    text: "Value Boxes"
  },
  plot: {
    'value-box': {
      text: "%kv",
      transform: {
        type: "date",
        all: "%G:%i:%s"
      }
    }
  },
  'scale-x': {
    'min-value': "1457101800000",
    'max-value': "1457125200000",
    step: "30minute",
    transform: {
      type: "date",
      all: "%g:%i"
    },
    label: {
      text: "Trading Day"
    },
    item: {
      'font-size': 10
    },
    'max-items': 14
  },
  utc: true,
  timezone: -5, //EST time
  'scale-y': {
    values: "30:34:1",
    format: "$%v",
    label: {
      text: "Price"
    },
    item: {
      'font-size': 10
    },
    guide: {
      'line-style': "solid"
    }
  },
  series: [{
    values: [
      [1457101800000, 30.34], //03/04/2016 at 9:30 a.m. EST (which is 14:30 in GMT)
      [1457103600000, 31.30], //10:00 a.m.
      [1457105400000, 30.95], //10:30 a.m.
      [1457107200000, 30.99], //11:00 a.m.
      [1457109000000, 32.33], //11:30 a.m.
      [1457110800000, 33.34], //12:00 p.m.
      [1457112600000, 33.01], //12:30 p.m.
      [1457114400000, 34], //1:00 p.m.
      [1457116200000, 33.64], //1:30 p.m.
      [1457118000000, 32.59], //2:00 p.m.
      [1457119800000, 32.60], //2:30 p.m.
      [1457121600000, 31.99], //3:00 p.m.
      [1457123400000, 31.14], //3:30 p.m.
      [1457125200000, 32.34], //at 4:00 p.m. EST (which is 21:00 GMT)
    ]
  }]
}
Crosshairs
The transform object can be used in both the plot and scale label portions of the crosshairs. However, remember that the plot-label object is tied to the nodes and the scale-label object is tied to the scales. This means that in the former, it is the %kvtoken (representing the parsed scale value) that corresponds to the time-series data. (In this portion, the %v token corresponds to the node value.) In the latter, it is the %v token (which, in this portion, is the scale value) that corresponds to the time-series data.
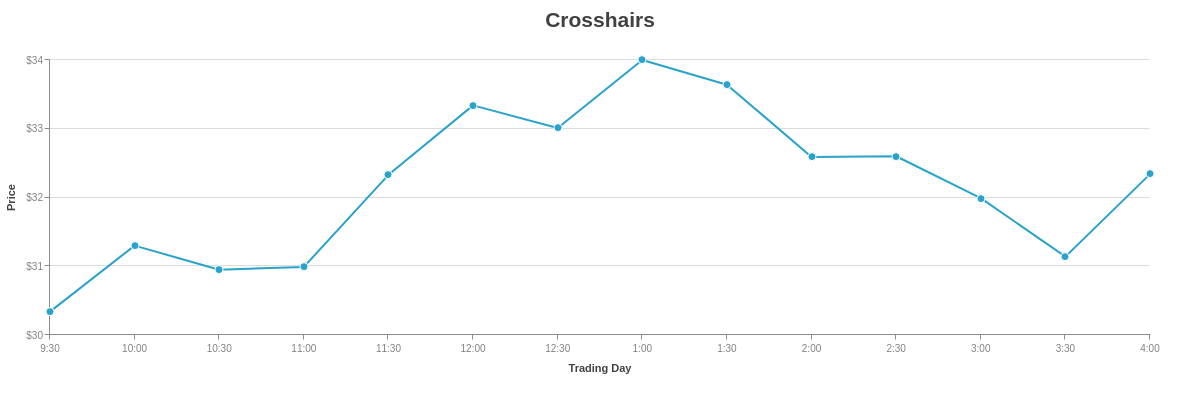
{
  type: "line",
  title: {
    text: "Crosshairs"
  },
  'crosshair-x': {
    'plot-label': { //tied to nodes.
      text: "$%v at %kv", //%kv is the parsed scale value
      transform: {
        type: "date",
        all: "%g:%i %A"
      }
    },
    'scale-label': { //tied to scales.
      text: "on %v", //%v is the scale value
      transform: {
        type: "date",
        all: "%D, %m/%d/%y"
      }
    }
  },
  plot: {
    tooltip: {
      visible: false
    }
  },
  'scale-x': {
    'min-value': "1457101800000",
    'max-value': "1457125200000",
    step: "30minute",
    transform: {
      type: "date",
      all: "%g:%i"
    },
    label: {
      text: "Trading Day"
    },
    item: {
      'font-size': 10
    },
    'max-items': 14
  },
  utc: true,
  timezone: -5, //EST time
  'scale-y': {
    values: "30:34:1",
    format: "$%v",
    label: {
      text: "Price"
    },
    item: {
      'font-size': 10
    },
    guide: {
      'line-style': "solid"
    }
  },
  series: [{
    values: [
      [1457101800000, 30.34], //03/04/2016 at 9:30 a.m. EST (which is 14:30 in GMT)
      [1457103600000, 31.30], //10:00 a.m.
      [1457105400000, 30.95], //10:30 a.m.
      [1457107200000, 30.99], //11:00 a.m.
      [1457109000000, 32.33], //11:30 a.m.
      [1457110800000, 33.34], //12:00 p.m.
      [1457112600000, 33.01], //12:30 p.m.
      [1457114400000, 34], //1:00 p.m.
      [1457116200000, 33.64], //1:30 p.m.
      [1457118000000, 32.59], //2:00 p.m.
      [1457119800000, 32.60], //2:30 p.m.
      [1457121600000, 31.99], //3:00 p.m.
      [1457123400000, 31.14], //3:30 p.m.
      [1457125200000, 32.34], //at 4:00 p.m. EST (which is 21:00 GMT)
    ]
  }]
}
Other
There are a limited number of tokens that can be used with legend tooltips and standalone labels.
Legend Tooltips
Legend tooltips appear when users hover over the items in the legend. They support a limited number of tokens:
| Token | Description |
|---|---|
%plot-description |
The description of the current plot, pulled from the description attribute in the plot/series object. |
%plot-text %t |
The text of the current plot, pulled from the text attribute in the plot/series object. |
To create legend tooltips, add a tooltip object to the legend object. Include the tokens in the tooltip's text attribute.
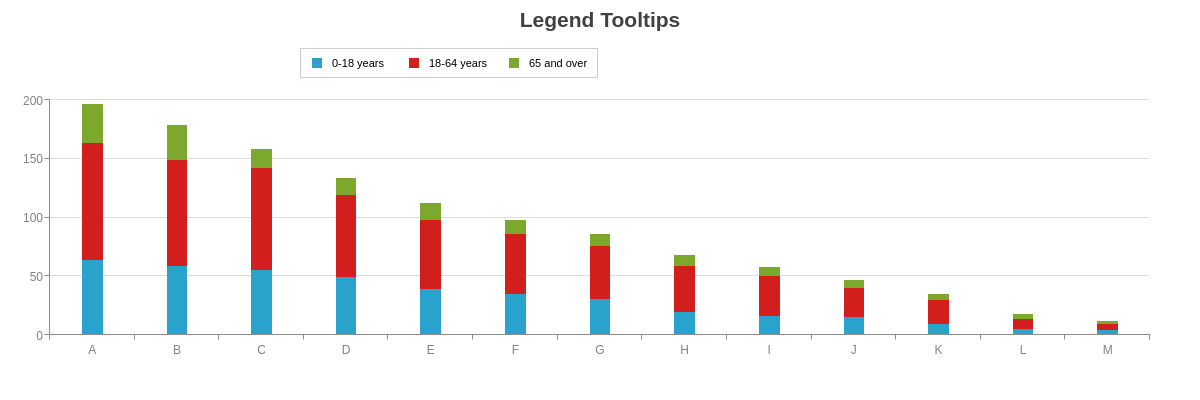
{
  type: 'bar',
  title: {
    text: "Legend Tooltips"
  },
  legend: {
    x: "25%",
    y: "12%",
    layout: "horizontal",
    tooltip: { //Legend Tooltips
      text: "The %plot-text population is %plot-description",
      width: "20%",
      height: "20%",
      'wrap-text': true,
      padding: "5%",
      'background-color': "white",
      'font-color': "black",
      'font-family': "Georgia",
      'border-width': 1,
      'border-color': "gray",
      'border-radius': "5px",
      sticky: true,
      timeout: 10000
    }
  },
  plotarea: {
    'margin-top': "25%"
  },
  plot: {
    stacked: true,
    'bar-width': "30%"
  },
  'scale-x': {
    labels: [ "A", "B", "C", "D", "E", "F", "G", "H", "I", "J", "K", "L", "M" ]
  },
  'scale-y': {
    values: "0:200:50"
  },
  series: [{
    values: [64, 59, 55, 49, 39, 35, 31, 20, 16, 15, 9, 5, 4],
    text: "0-18 years",
    description: "depicted in blue."
  }, {
    values: [99, 90, 87, 70, 59, 51, 45, 39, 34, 25, 21, 9, 5],
    text: "18-64 years",
    description: "depicted in red."
  }, {
    values: [34, 30, 16, 15, 14, 12, 10, 9, 8, 7, 5, 4, 3],
    text: "65 and over",
    description: "depicted in green."
  }]
}
Standalone Labels
Standalone labels differ from other label types (tooltips, value boxes, crosshairs) because they are not tied in any way to the nodes. They support a limited number of tokens:
| Token | Description |
|---|---|
(%node-value)(#)(#) |
Node value of a specified plot and node index, provided in the following format: (%node-value)(plot number)(node index number), e.g., (%node-value)(0)(0)). Note: Plot and node index numbering begins at zero. |
%node-percent-value %npv |
Percentage value of the hovered over node relative to the sum of all nodes. Demo |
%plot-#-value |
Node value of a specified plot, provided in the following format: %plot-plot number-value, e.g., %plot-0-value. This token is best used with crosshairs. Note: Plot numbering begins at zero. Demo |
%plot-value |
Node value of the hovered over value. This token is best used with tooltips. Demo |
Because standalone labels are not tied to the nodes, the relationship to a series or node must be called out specifically. To add standalone labels, create a labels array. Inside the array, create an object for each label. Refer to the Labels Tutorial for more information. In the following chart, three labels were created.
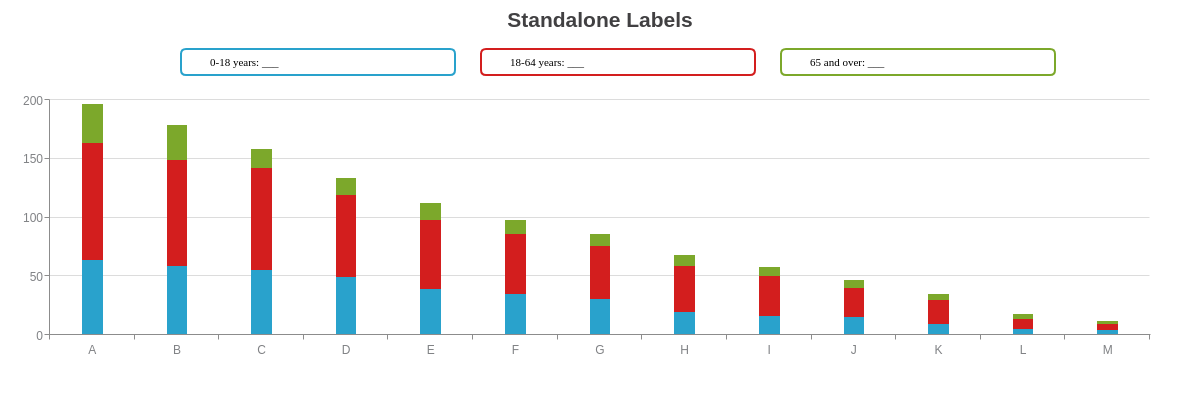
{
  type: 'bar',
  title: {
    text: "Standalone Labels"
  },
  labels: [{ //Label One
    text: "0-18 years: %plot-0-value",
    'default-value': "___", //optional placeholder for token text
    height: "7%",
    width: "23%",
    x: "15%",
    y: "12%",
    'text-align': "left", //to keep text stationary
    'font-color': "black",
    'font-family': "Georgia",
    'border-width': 2,
    'border-color': "#29A2CC",
    'border-radius': "5px",
    'padding-left': "30%"
  }, { //Label Two
    text: "18-64 years: %plot-1-value",
    'default-value': "___",
    height: "7%",
    width: "23%",
    x: "40%",
    y: "12%",
    'text-align': "left",
    'font-color': "black",
    'font-family': "Georgia",
    'border-width': 2,
    'border-color': "#D31E1E",
    'border-radius': "5px",
    'padding-left': "30%"
  }, { //Label Three
    text: "65 and over: %plot-2-value",
    'default-value': "___",
    height: "7%",
    width: "23%",
    x: "65%",
    y: "12%",
    'text-align': "left",
    'font-color': "black",
    'font-family': "Georgia",
    'border-width': 2,
    'border-color': "#7CA82B",
    'border-radius': "5px",
    padding: "30%"
  }],
  plotarea: {
    'margin-top': "25%"
  },
  plot: {
    stacked: true,
    'bar-width': "30%",
    tooltip: {
      visible: false
    }
  },
  'crosshair-x': {
    'plot-label': {
      visible: false
    }
  },
  'scale-x': {
    labels: [ "A", "B", "C", "D", "E", "F", "G", "H", "I", "J", "K", "L", "M" ]
  },
  'scale-y': {
    values: "0:200:50"
  },
  series: [{
    values: [64, 59, 55, 49, 39, 35, 31, 20, 16, 15, 9, 5, 4],
    text: "0-18 years"
  }, {
    values: [99, 90, 87, 70, 59, 51, 45, 39, 34, 25, 21, 9, 5],
    text: "18-64 years"
  }, {
    values: [34, 30, 16, 15, 14, 12, 10, 9, 8, 7, 5, 4, 3],
    text: "65 and over"
  }]
}
Summary
Tokens allow dynamically generated text based on some chart value. This allows dynamic labels, styling of tooltips and crosshairs, and rule configuration.