See what ZingChart's 50+ built-in chart types & modules can do for your data visualization projects.
Create animated & interactive charts with hundreds of thousands of data records using the ZingChart JavaScript charting library.
Create a ZingChart using a simple to understand JSON configuration
Choose from Over 50 Built-In Chart Types and Modules
View all chart Types
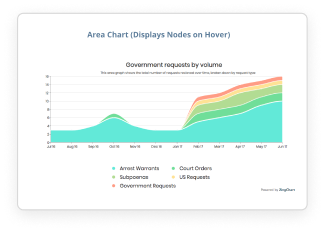
area
3D area
bar
3D bar
100% Stacked
box plot
bubble pie
bubble
bubble pack
bullet
calendar
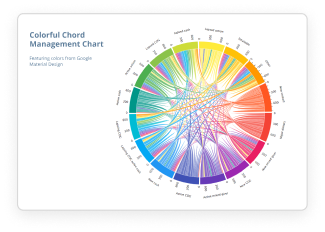
chord
depth
flame
funnel
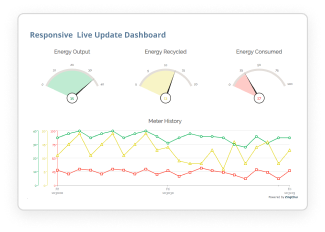
gauge
grid
Heat map
Heatmap Plugin
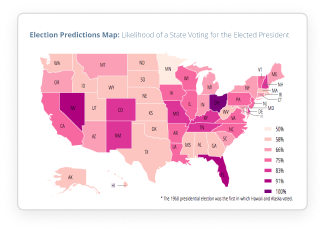
maps
line
3D line
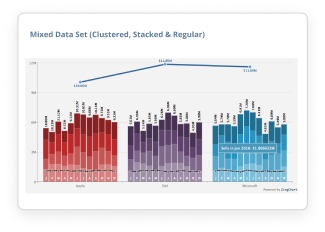
mixed
nested pie
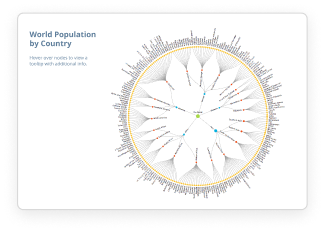
Network Diagrams
pareto
pictograph
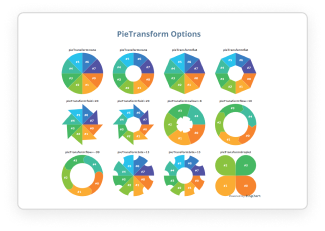
pie
3D pie
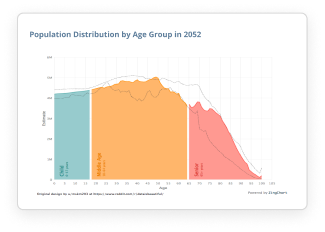
pop. pyramids
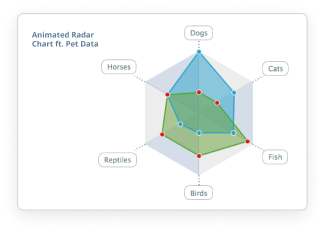
radar
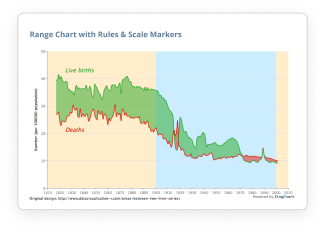
range
rankflow
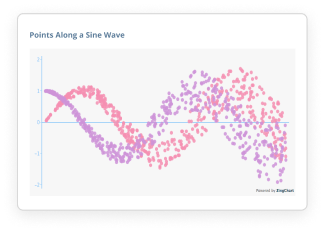
scatter
scatter-heatmap
scorecard
stock
stream
tile map
tree
treemaps
variwide
vector plot
venn diagrams
violin
waterfall
word cloud
ZingChart is Packed with Helpful Features
View FeaturesZingChart Integrates with Popular JavaScript Development Stacks
JavaScript
ZingChart is dependency free and pure JavaScript.
-
Install via NPM
npm install zingchartAfter downloading package locally, include the script using ES6 Modules:
import {zingchart, ZC} from './zingchart/es6.js';
// Modules must be imported EXPLICITLY when using es6 version
import './zingchart/modules-es6/zingchart-pareto.min.js';
For quickest download, use the ZingChart CDN:
<script src="https://cdn.zingchart.com/zingchart.min.js"></script> -
Add your chart element wrapper
<div id="myChart"></div> -
Include the library in your HTML document and then render your chart!
<!-- Just before the closing body tag is best -->
<script src="https://cdn.zingchart.com/zingchart.min.js"></script>
<script>
  zingchart.render({
    id: 'myChart',
    data: {
      type: 'line',
      series: [
        { values: [54,23,34,23,43] },
        { values: [10,15,16,20,40] }
      ]
    }
  });
</script>
</body>
React
Quickly create dynamic JavaScript charts with ZingChart and React.
-
Install via NPM
npm install zingchart-react -
Include zingchart lib and the component
import 'zingchart/es6'; import ZingChart from 'zingchart-react'; class App extends Component { ... } -
Build a chart configuration
class App extends Component { constructor(props) { super(props); this.state = { config: { type: 'bar', series: [{ values: [4,5,3,4,5,3,5,4,11] }] } } } ... } -
Create and render your chart
class App extends Component {
...
render() {
  return (
    <div>
      <ZingChart data={this.state.config}/>
    </div>
  );
}
...
Angular
ZingChart's Angular wrapper helps you create JavaScript charts with two-way data binding.
-
Install via NPM
npm install zingchart-angular -
Include the module in your module declaration file
import { ZingchartAngularModule } from 'zingchart-angular'; @NgModule({ imports: [ ... ZingchartAngularModule, ], }) -
Define your chart configuration in your component
config:zingchart.graphset = { type: 'line', series: [{ values: [3,6,4,6,4,6,4,6] }], }; -
Add your component to the markup
<zingchart-angular [config]="config" [height]="500"></zingchart-angular>
Vue
Easily add charts in your Vue application with our component.
-
Install via NPM
npm install zingchart-vue -
Register the component and include zingchart in your app
import 'zingchart/es6'; import Vue from 'vue'; import zingchartVue from 'zingchart-vue'; Vue.component('zingchart', zingchartVue); -
Add the component to your markup
<zingchart :data="myConfig" :height="300" :width="600"/> -
Define your chart configuration in your app
export default {
  data() {
    return {
      type: 'line',
      series: [{
        values: [43,23,54,54,39,47,38,59,39,49]
      }]
    }
  }
}
Web Component
Easily add charts in your application with our web component.
-
Install via NPM
npm install zingchart-web-component -
Import the generic zingchart component
OR Manually import each chart and register it as a web componentimport ZingChart from 'zingchart-web-component'; customElements.define('zing-chart', ZingChart);import {Line} from 'zingchart-web-component/charts/ZCLine.js'; customElements.define('zc-line', Line); -
Add the component to your markup
Or While everything can be configured via the data property, you can also fully configure ZingChart via child components<zing-chart data='{"type": "line", "series": {["values": 1,2,3,4,5,6,4]}}'> </zing-chart><zc-line> <zc-legend draggable></zc-legend> <zc-series> <zc-series-0 values="[3,4,3,2,4,3,3]"></zc-series-0> </zc-series> </zc-line>
AngularJS
ZingChart's AngularJS wrapper helps you create JavaScript charts with two-way data binding.
-
Install via NPM
npm install zingchart-angularjs -
Inject the directive into your application
angular.module('myApp', ['zingchart-angularjs']); -
Configure your chart through a scope variable
$scope.myJson = { type: 'line', series: [ { values: [54,23,34,23,43] }, { values: [10,15,16,20,40] } ] }; -
Insert the ZingChart-AngularJS directive into your application
<zingchart id="myChart" data-zc-json="myJson" data-zc-height=500 data-zc-width=600></zingchart>
Create interactive JavaScript charts all in PHP with ZingChart's PHP wrapper.
-
Install via Composer
composer require zingchart/php_wrapper -
Include the library
require __DIR__ . '/vendor/autoload.php; -
Render your chart
$zc = new ZC("myChart");
$zc->setChartType("bar");
$zc->setSeriesData([1,4,2,6,3]);
$zc->render();
jQuery
Easily create and modify JavaScript charts with ZingChart's jQuery wrapper.
-
Include jQuery, ZingChart, and the jQuery wrapper
<script src="https://code.jquery.com/jquery-1.12.4.min.js"></script> <script src="https://cdn.zingchart.com/zingchart.min.js"></script> <script src="https://cdn.zingchart.com/zingchart.jquery.min.js"></script> -
Create a
<div>with an ID<div id="myChart"></div> -
Create your chart inside the
$(document).ready()function$(document).ready(function() { $('#myChart').zingchart({ data: { type: 'line', series: [{ values: [1,2,5,3,9,4] }] } }); });
Svelte
Quickly create dynamic JavaScript charts with ZingChart and Svelte.
-
Install via NPM
npm install zingchart-svelte -
Include zingchart lib and the component
import 'zingchart/es6'; import ZingChart from 'zingchart-svelte'; -
Build a chart configuration
const config = { type: 'bar', series: [ { values: [4,5,3,4,5,3,5,4,11] } ] } -
Add your component to the markup
<ZingChart data={config} />
We've been trusted with advanced data-visualization solutions for worldwide organizations since 2008

We've Got Your Business Concerns Covered
))


Made with Love in San Diego, California
About the CompanyWe created ZingChart because other JavaScript charting libraries didn’t suit our needs as developers and data-visualization professionals.
