<!doctype html>
<html class="zc-html">
<head>
<meta charset="utf-8">
<title>ZingSoft Demo</title>
<script nonce="undefined" src="https://cdn.zingchart.com/zingchart.min.js"></script>
<style>
.chart--container {
height: 100%;
width: 100%;
min-height: 530px;
}
.zc-ref {
display: none;
}
</style>
</head>
<body class="zc-body">
<!-- CHART CONTAINER -->
<div id="myChart" class="chart--container">
<a class="zc-ref" href="https://www.zingchart.com/">Powered by ZingChart</a>
</div>
<!-- Import data -->
<script nonce="undefined" src='https://s3-us-west-2.amazonaws.com/s.cdpn.io/374756/population.js'></script>
<script>
ZC.LICENSE = ["569d52cefae586f634c54f86dc99e6a9", "b55b025e438fa8a98e32482b5f768ff5"]; // window:load event for Javascript to run after HTML
// because this Javascript is injected into the document head
window.addEventListener('load', () => {
// Javascript code to execute after DOM content
// point to modules directory
zingchart.MODULESDIR = 'https://cdn.zingchart.com/modules/';
/* find min/max years */
let iStartYear = 9999,
iEndYear = 0,
k;
for (let k in _DATA_) {
iStartYear = Math.min(iStartYear, parseInt(k, 10));
iEndYear = Math.max(iEndYear, parseInt(k, 10));
}
let aSeries = [],
aYears = [],
nrCurrent = 0;
for (k in _DATA_) {
aSeries[k] = [];
aSeries[k][0] = [];
aSeries[k][1] = [];
aSeries[k][2] = [];
aSeries[k][3] = [];
aSeries[k][4] = [];
aYears.push(k);
for (let i = 1; i < _DATA_[k].length; i++) {
if (i > 0 && i <= 18) {
aSeries[k][0].push([i - 1, _DATA_[k][i]]);
}
if (i >= 19 && i <= 65) {
aSeries[k][1].push([i - 1, _DATA_[k][i]]);
}
if (i >= 66) {
aSeries[k][2].push([i - 1, _DATA_[k][i]]);
}
aSeries[k][3].push([i - 1, _DATA_[iStartYear + ''][i]]);
aSeries[k][4].push([i - 1, _DATA_[iEndYear + ''][i]]);
}
}
let chartConfig = {
type: 'mixed',
backgroundColor: '#fff',
title: {
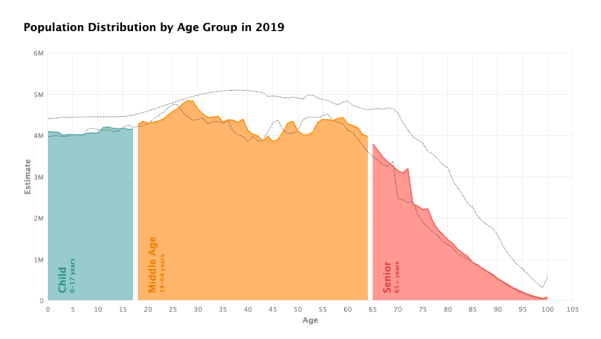
text: 'Population Distribution by Age Group in 2016',
align: 'left',
fontColor: '#000',
fontSize: '18px',
paddingLeft: '20px'
},
plot: {
alphaArea: 1,
hoverState: {
visible: false
},
marker: {
visible: false
},
maxTrackers: 0
},
plotarea: {
marginLeft: '60px'
},
source: {
text: 'Original design by u/mskm203 at https://www.reddit.com/r/dataisbeautiful/',
url: 'https://www.reddit.com/r/dataisbeautiful/comments/9ui848/oc_us_population_projections_by_age_through_2060/',
align: 'left',
target: '_blank'
},
scaleX: {
itemsOverlap: true,
lineWidth: 1,
lineColor: '#eee',
minValue: 0,
maxValue: 105,
maxItems: 999,
step: 5,
guide: {
lineColor: '#eee',
lineStyle: 'solid',
visible: true
},
item: {
color: '#878A8C',
fontSize: '11px',
fontWeight: 'normal'
},
label: {
text: 'Age',
fontColor: '#878A8C',
fontSize: '13px',
fontWeight: 'bold'
},
markers: [{
type: 'area',
alpha: 0,
backgroundColor: '#97CBCD',
label: {
text: 'Child<br><span style="font-size:10px;">0-17 years</span>',
align: 'left',
fontColor: '#2c8e8d',
fontSize: '16px',
fontWeight: 'bold',
padding: '5px 5px 15px 10px'
},
valueRange: true,
range: [0, 17]
},
{
type: 'area',
alpha: 0,
backgroundColor: '#FFB66B',
label: {
text: 'Middle Age<br><span style="font-size:10px;">18-64 years</span>',
align: 'left',
fontSize: '16px',
fontColor: '#ed7e00',
fontWeight: 'bold',
padding: '5px 5px 15px 10px'
},
valueRange: true,
range: [18, 64]
},
{
type: 'area',
alpha: 0,
backgroundColor: '#FF9991',
label: {
text: 'Senior<br><span style="font-size:10px;">65+ years</span>',
align: 'left',
fontSize: '16px',
fontColor: '#e03d38',
fontWeight: 'bold',
padding: '5px 5px 15px 10px'
},
valueRange: true,
range: [65, 100]
}
],
tick: {
visible: false
}
},
scaleY: {
minValue: 0,
maxValue: 6000000,
format: '%v',
short: true,
label: {
text: 'Estimate',
fontColor: '#878A8C',
fontSize: '13px',
fontWeight: 'bold'
},
lineWidth: '1px',
lineColor: '#eee',
item: {
color: '#878A8C',
fontSize: '11px',
fontWeight: 'normal'
},
guide: {
visible: true,
lineStyle: 'solid',
lineColor: '#eee'
},
tick: {
visible: false
}
},
series: [{
type: 'area',
values: aSeries[aYears[nrCurrent]][0],
backgroundColor: '#97CBCD',
lineColor: '#5BAFAE'
},
{
type: 'area',
values: aSeries[aYears[nrCurrent]][1],
backgroundColor: '#FFB66B',
lineColor: '#FF900C'
},
{
type: 'area',
values: aSeries[aYears[nrCurrent]][2],
backgroundColor: '#FF9991',
lineColor: '#FF5C55'
},
{
type: 'line',
values: aSeries[aYears[nrCurrent]][3],
lineStyle: 'dotted',
lineWidth: '1px',
lineColor: '#333'
},
{
type: 'line',
values: aSeries[aYears[nrCurrent]][4],
lineStyle: 'dotted',
lineWidth: '1px',
lineColor: '#333'
}
]
};
let update = function() {
if (nrCurrent < aYears.length - 1) {
nrCurrent++;
} else {
nrCurrent = 0;
}
zingchart.exec('myChart', 'modify', {
object: 'title',
data: {
text: 'Population Distribution by Age Group in ' + aYears[nrCurrent]
},
update: false
});
zingchart.exec('myChart', 'setseriesvalues', {
graphid: 0,
values: aSeries[aYears[nrCurrent]]
});
};
zingchart.render({
id: 'myChart',
data: chartConfig,
output: "svg",
width: '100%',
height: '100%',
events: {
load: function() {
setInterval(function() {
update();
}, 100);
}
}
});
});
</script>
</body>
</html>
// window:load event for Javascript to run after HTML
// because this Javascript is injected into the document head
window.addEventListener('load', () => {
  // Javascript code to execute after DOM content
  // point to modules directory
  zingchart.MODULESDIR = 'https://cdn.zingchart.com/modules/';

  /* find min/max years */
  let iStartYear = 9999, iEndYear = 0, k;
  for (let k in _DATA_) {
    iStartYear = Math.min(iStartYear, parseInt(k, 10));
    iEndYear = Math.max(iEndYear, parseInt(k, 10));
  }

  let aSeries = [], aYears = [], nrCurrent = 0;
  for (k in _DATA_) {
    aSeries[k] = [];
    aSeries[k][0] = [];
    aSeries[k][1] = [];
    aSeries[k][2] = [];
    aSeries[k][3] = [];
    aSeries[k][4] = [];

    aYears.push(k);
    for (let i = 1; i < _DATA_[k].length; i++) {
      if (i > 0 && i <= 18) {
        aSeries[k][0].push([i - 1, _DATA_[k][i]]);
      }
      if (i >= 19 && i <= 65) {
        aSeries[k][1].push([i - 1, _DATA_[k][i]]);
      }
      if (i >= 66) {
        aSeries[k][2].push([i - 1, _DATA_[k][i]]);
      }
      aSeries[k][3].push([i - 1, _DATA_[iStartYear + ''][i]]);
      aSeries[k][4].push([i - 1, _DATA_[iEndYear + ''][i]]);
    }
  }

  let chartConfig = {
    type: 'mixed',
    backgroundColor: '#fff',
    title: {
      text: 'Population Distribution by Age Group in 2016',
      align: 'left',
      fontColor: '#000',
      fontSize: '18px',
      paddingLeft: '20px'
    },
    plot: {
      alphaArea: 1,
      hoverState: {
        visible: false
      },
      marker: {
        visible: false
      },
      maxTrackers: 0
    },
    plotarea: {
      marginLeft: '60px'
    },
    source: {
      text: 'Original design by u/mskm203 at https://www.reddit.com/r/dataisbeautiful/',
      url: 'https://www.reddit.com/r/dataisbeautiful/comments/9ui848/oc_us_population_projections_by_age_through_2060/',
      align: 'left',
      target: '_blank'
    },
    scaleX: {
      itemsOverlap: true,
      lineWidth: 1,
      lineColor: '#eee',
      minValue: 0,
      maxValue: 105,
      maxItems: 999,
      step: 5,
      guide: {
        lineColor: '#eee',
        lineStyle: 'solid',
        visible: true
      },
      item: {
        color: '#878A8C',
        fontSize: '11px',
        fontWeight: 'normal'
      },
      label: {
        text: 'Age',
        fontColor: '#878A8C',
        fontSize: '13px',
        fontWeight: 'bold'
      },
      markers: [
        {
          type: 'area',
          alpha: 0,
          backgroundColor: '#97CBCD',
          label: {
            text: 'Child<br><span style="font-size:10px;">0-17 years</span>',
            align: 'left',
            fontColor: '#2c8e8d',
            fontSize: '16px',
            fontWeight: 'bold',
            padding: '5px 5px 15px 10px'
          },
          valueRange: true,
          range: [0, 17]
        },
        {
          type: 'area',
          alpha: 0,
          backgroundColor: '#FFB66B',
          label: {
            text: 'Middle Age<br><span style="font-size:10px;">18-64 years</span>',
            align: 'left',
            fontSize: '16px',
            fontColor: '#ed7e00',
            fontWeight: 'bold',
            padding: '5px 5px 15px 10px'
          },
          valueRange: true,
          range: [18, 64]
        },
        {
          type: 'area',
          alpha: 0,
          backgroundColor: '#FF9991',
          label: {
            text: 'Senior<br><span style="font-size:10px;">65+ years</span>',
            align: 'left',
            fontSize: '16px',
            fontColor: '#e03d38',
            fontWeight: 'bold',
            padding: '5px 5px 15px 10px'
          },
          valueRange: true,
          range: [65, 100]
        }
      ],
      tick: {
        visible: false
      }
    },
    scaleY: {
      minValue: 0,
      maxValue: 6000000,
      format: '%v',
      short: true,
      label: {
        text: 'Estimate',
        fontColor: '#878A8C',
        fontSize: '13px',
        fontWeight: 'bold'
      },
      lineWidth: '1px',
      lineColor: '#eee',
      item: {
        color: '#878A8C',
        fontSize: '11px',
        fontWeight: 'normal'
      },
      guide: {
        visible: true,
        lineStyle: 'solid',
        lineColor: '#eee'
      },
      tick: {
        visible: false
      }
    },
    series: [
      {
        type: 'area',
        values: aSeries[aYears[nrCurrent]][0],
        backgroundColor: '#97CBCD',
        lineColor: '#5BAFAE'
      },
      {
        type: 'area',
        values: aSeries[aYears[nrCurrent]][1],
        backgroundColor: '#FFB66B',
        lineColor: '#FF900C'
      },
      {
        type: 'area',
        values: aSeries[aYears[nrCurrent]][2],
        backgroundColor: '#FF9991',
        lineColor: '#FF5C55'
      },
      {
        type: 'line',
        values: aSeries[aYears[nrCurrent]][3],
        lineStyle: 'dotted',
        lineWidth: '1px',
        lineColor: '#333'
      },
      {
        type: 'line',
        values: aSeries[aYears[nrCurrent]][4],
        lineStyle: 'dotted',
        lineWidth: '1px',
        lineColor: '#333'
      }
    ]
  };

  let update = function () {
    if (nrCurrent < aYears.length - 1) {
      nrCurrent++;
    } else {
      nrCurrent = 0;
    }

    zingchart.exec('myChart', 'modify', {
      object: 'title',
      data: {
        text: 'Population Distribution by Age Group in ' + aYears[nrCurrent]
      },
      update: false
    });

    zingchart.exec('myChart', 'setseriesvalues', {
      graphid: 0,
      values: aSeries[aYears[nrCurrent]]
    });
  };

  zingchart.render({
    id: 'myChart',
    data: chartConfig,
    output: "svg",
    width: '100%',
    height: '100%',
    events: {
      load: function () {
        setInterval(function () {
          update();
        }, 100);
      }
    }
  });
});