<!DOCTYPE html>
<html>
<head>
<meta charset="utf-8">
<title>ZingSoft Demo</title>
<script nonce="undefined" src="https://cdn.zingchart.com/zingchart.min.js"></script>
<style>
.zc-body {
background-color: #fff;
}
.chart--container {
width: 100%;
height: 100%;
min-height: 530px;
}
.zc-ref {
display: none;
}
</style>
</head>
<body>
<div id="myChart" class="chart--container">
<a class="zc-ref" href="https://www.zingchart.com/">Powered by ZingChart</a>
</div>
<script>
ZC.LICENSE = ["569d52cefae586f634c54f86dc99e6a9", "b55b025e438fa8a98e32482b5f768ff5"];
let chartConfig = {
type: 'radar',
plot: {
aspect: 'area',
animation: {
effect: 3,
sequence: 1,
speed: 700,
},
},
scaleV: {
visible: false,
},
scaleK: {
values: '0:5:1',
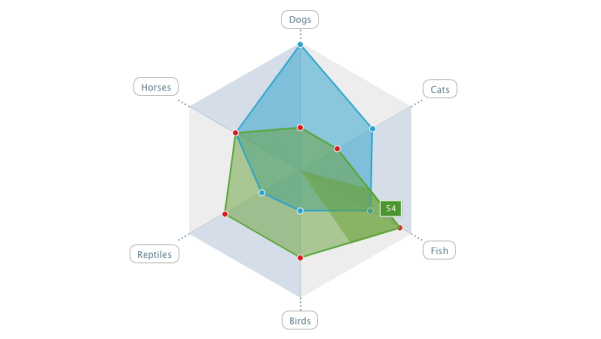
labels: ['Dogs', 'Cats', 'Fish', 'Birds', 'Reptiles', 'Horses'],
guide: {
alpha: 0.3,
backgroundColor: '#c5c5c5 #718eb4',
lineColor: '#607D8B',
lineStyle: 'solid',
},
item: {
backgroundColor: 'white',
borderColor: '#aeaeae',
borderRadius: '10px',
borderWidth: '1px',
fontColor: '#607D8B',
padding: '5 10',
},
tick: {
lineColor: '#59869c',
lineWidth: '2px',
lineStyle: 'dotted',
size: 20,
},
},
series: [{
values: [59, 39, 38, 19, 21, 35],
text: 'farm',
},
{
values: [20, 20, 54, 41, 41, 35],
backgroundColor: '#689F38',
lineColor: '#53a534',
},
],
};
zingchart.render({
id: 'myChart',
data: chartConfig,
height: '100%',
width: '100%',
});
</script>
</body>
</html>
let chartConfig = {
  type: 'radar',
  plot: {
    aspect: 'area',
    animation: {
      effect: 3,
      sequence: 1,
      speed: 700,
    },
  },
  scaleV: {
    visible: false,
  },
  scaleK: {
    values: '0:5:1',
    labels: ['Dogs', 'Cats', 'Fish', 'Birds', 'Reptiles', 'Horses'],
    guide: {
        alpha: 0.3,
        backgroundColor: '#c5c5c5 #718eb4',
        lineColor: '#607D8B',
        lineStyle: 'solid',
      },
    item: {
      backgroundColor: 'white',
      borderColor: '#aeaeae',
      borderRadius: '10px',
      borderWidth: '1px',
      fontColor: '#607D8B',
      padding: '5 10',
    },
    tick: {
      lineColor: '#59869c',
      lineWidth: '2px',
      lineStyle: 'dotted',
      size: 20,
    },
  },
  series: [
    {
      values: [59, 39, 38, 19, 21, 35],
      text: 'farm',
    },
    {
      values: [20, 20, 54, 41, 41, 35],
      backgroundColor: '#689F38',
      lineColor: '#53a534',
    },
  ],
};

zingchart.render({
  id: 'myChart',
  data: chartConfig,
  height: '100%',
  width: '100%',
});