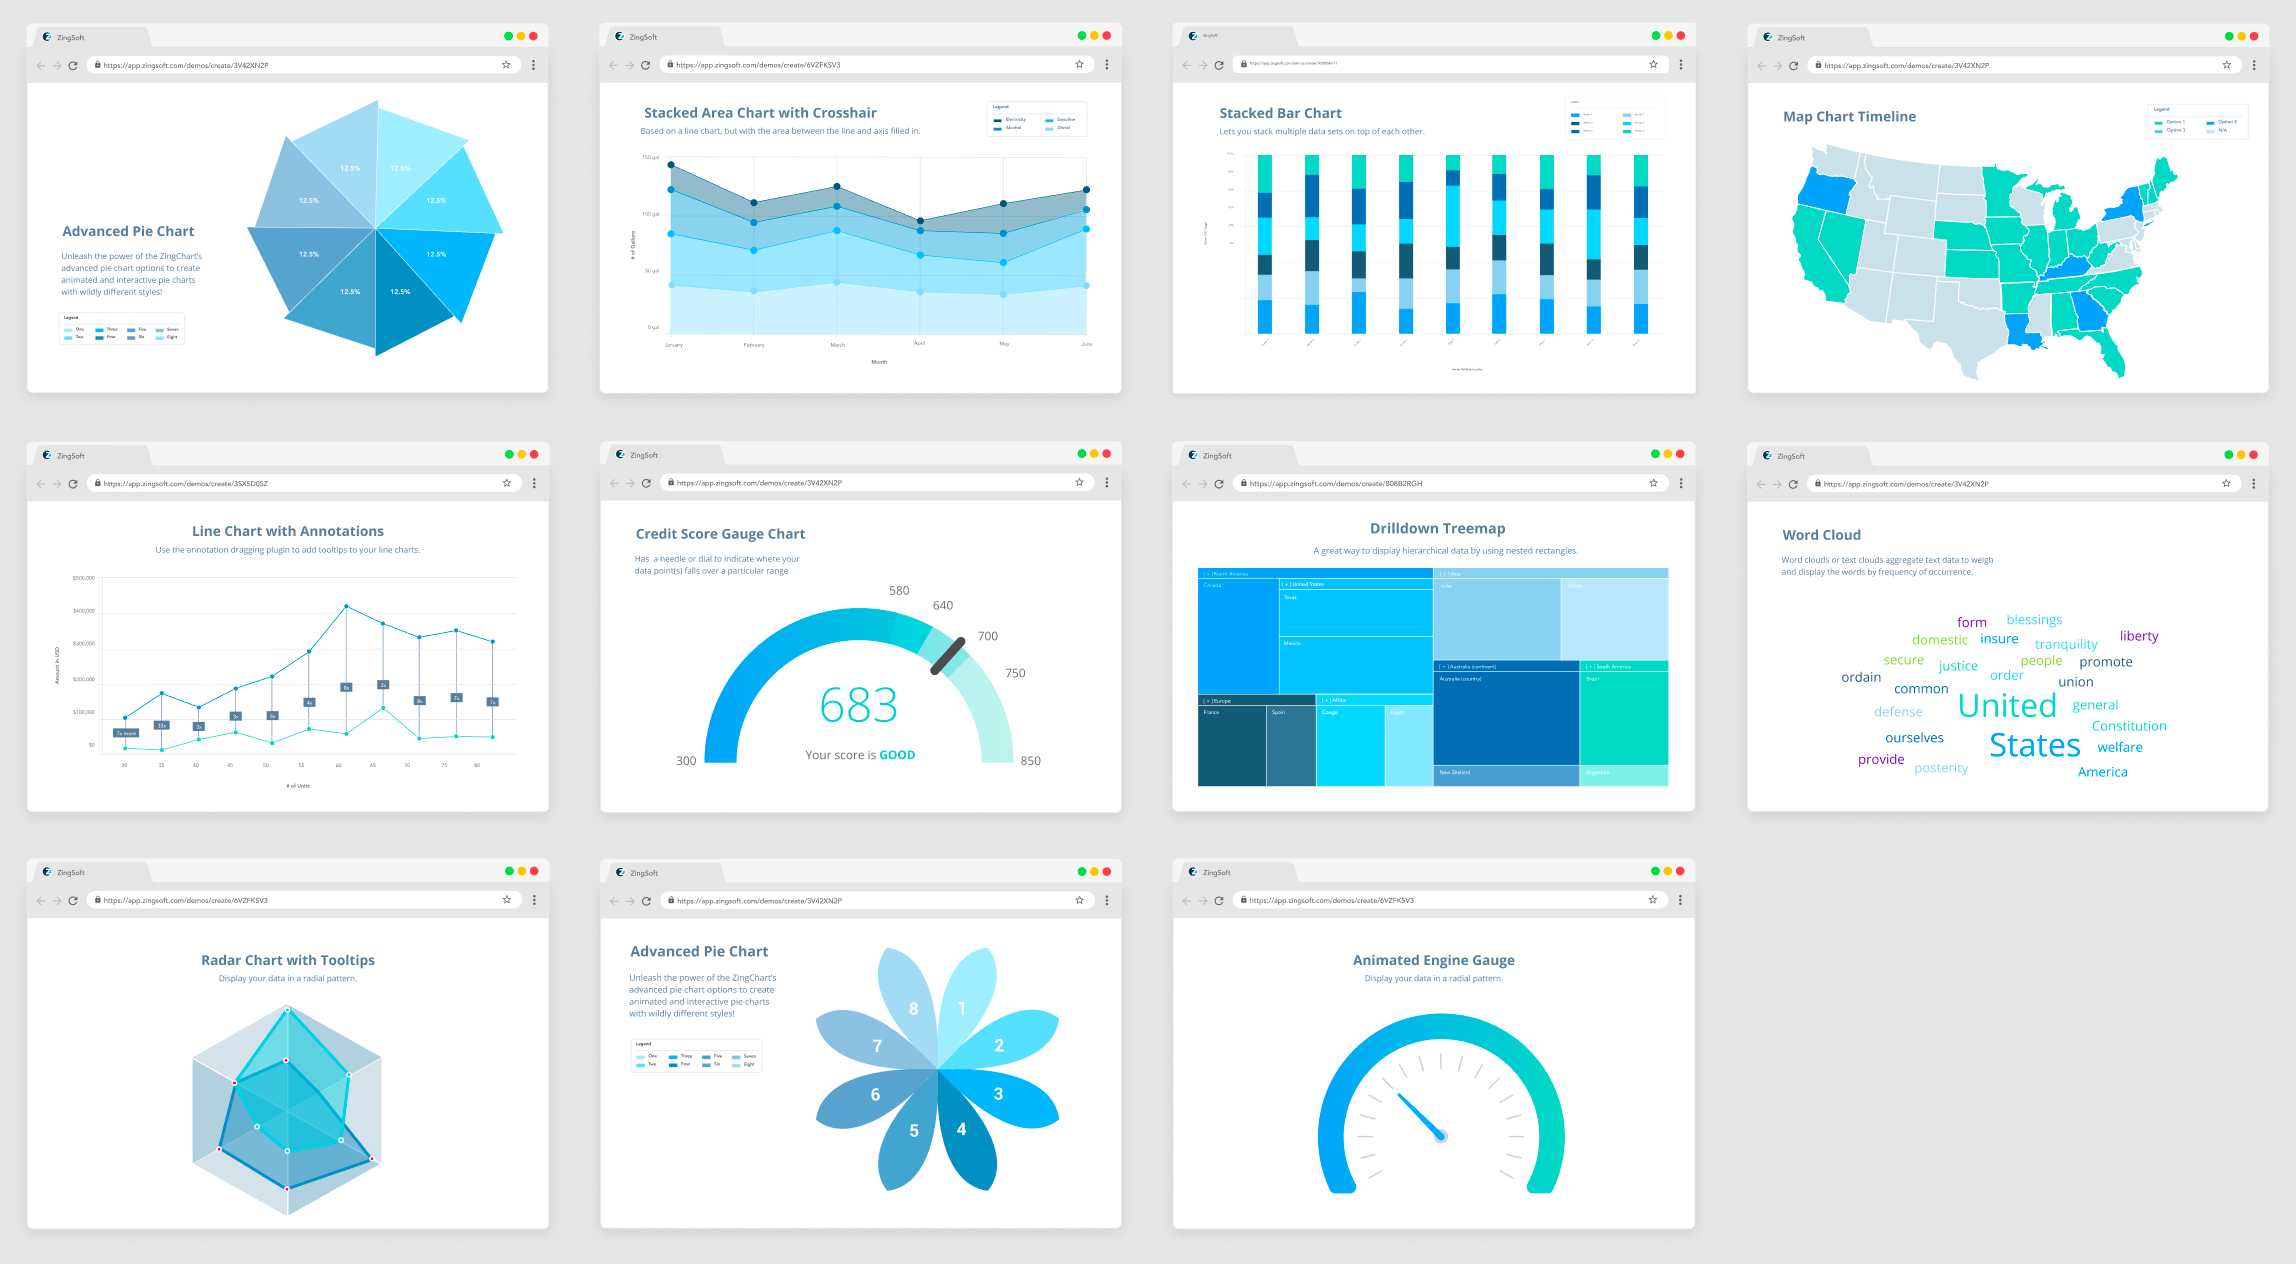
Styling for every level of development experience
Everything in ZingChart can be styled with an easy-to-use CSS-like syntax, from margins and padding to colors and gradients. Just declare it in your JSON configuration!
ZingChart comes with a set theme, but every component of the chart can be styled via the JSON configuration. Need some inspiration? Head over to our demo gallery where you'll find live fully customized and interactive charts.
Don't have a specific style requirement and just want good looking charts? We've done the hard work for you! We have built a number of custom themes that are ready for you to use.
We've built ZingChart to be user-friendly no matter the user's experience on the web. From novices to seasoned veterans, our charts are easy to create with a simple JSON configuration. Our extensive documentation outlines each attribute and the values it can take.
{ "type": "line", "title": { "text": "My First Chart" }, "series": [ { "values": [20,40,25,50,15,45,33,34] }, { "values": [5,30,21,18,59,50,28,33] }, { "values": [30,5,18,21,33,41,29,15] } ] }