<!DOCTYPE html>
<html>
<head>
<meta charset="utf-8">
<title>ZingSoft Demo</title>
<link href='//fonts.googleapis.com/css?family=Roboto:300' rel='stylesheet' type='text/css'>
<script nonce="undefined" src="https://cdn.zingchart.com/zingchart.min.js"></script>
<style>
.chart--container {
height: 100%;
width: 100%;
min-height: 530px;
}
.zc-ref {
display: none;
}
</style>
</head>
<body>
<div id="myChart" class="chart--container"><a class="zc-ref" href="https://www.zingchart.com/">Powered by ZingChart</a></div>
<script>
ZC.LICENSE = ["569d52cefae586f634c54f86dc99e6a9", "b55b025e438fa8a98e32482b5f768ff5"];
let chartConfig = {
type: 'area',
globals: {
fontFamily: 'Roboto',
},
backgroundColor: '#fff',
title: {
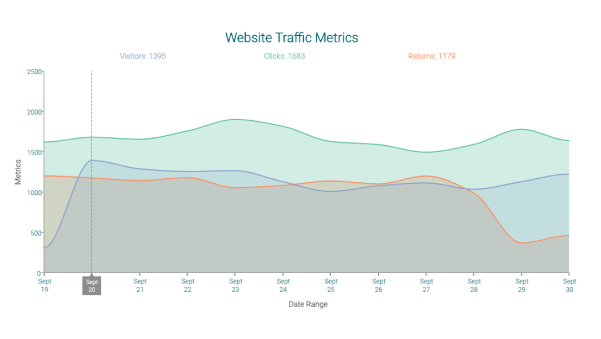
text: 'Website Traffic Metrics',
adjustLayout: true,
backgroundColor: 'none',
fontColor: '#05636c',
fontSize: '24px',
height: '25px',
y: '15px',
},
plot: {
tooltip: {
text: 'There were %v %t on %data-days',
borderRadius: '5px',
fontFamily: 'Roboto',
fontSize: '15px',
padding: '10px',
textAlign: 'left',
},
lineWidth: '2px',
marker: {
size: '1px',
visible: false,
},
},
plotarea: {
adjustLayout: true,
marginBottom: 'dynamic',
marginLeft: 'dynamic',
marginRight: 'dynamic',
marginTop: '10%',
},
scaleX: {
guide: {
lineWidth: '0px',
},
item: {
fontColor: '#05636c',
textAlign: 'center',
},
itemsOverlap: true,
label: {
text: 'Date Range',
fontSize: '14px',
fontWeight: 'normal',
offsetX: '10%',
},
labels: [
'Sept<br>19',
'Sept<br>20',
'Sept<br>21',
'Sept<br>22',
'Sept<br>23',
'Sept<br>24',
'Sept<br>25',
'Sept<br>26',
'Sept<br>27',
'Sept<br>28',
'Sept<br>29',
'Sept<br>30',
],
maxItems: 12,
maxLabels: 12,
tick: {
lineWidth: '2px',
},
zooming: true,
},
scaleY: {
values: '0:2500:500',
guide: {
alpha: 0.2,
lineStyle: 'dashed',
lineWidth: '0px',
},
item: {
fontColor: '#05636c',
fontWeight: 'normal',
},
label: {
text: 'Metrics',
fontSize: '14px',
},
},
crosshairX: {
lineColor: '#898989',
lineStyle: 'dashed',
lineWidth: '1px',
marker: {
size: '4px',
visible: true,
},
plotLabel: {
visible: false,
},
},
labels: [{
text: 'Visitors: %plot-2-value',
bold: false,
color: '#8da0cb',
defaultValue: '',
fontSize: '14px',
fontWeight: 'bold',
textAlign: 'left',
width: '120px',
x: '20%',
y: '50px',
},
{
text: 'Clicks: %plot-1-value',
bold: false,
color: '#66c2a5',
defaultValue: '',
fontSize: '14px',
fontWeight: 'bold',
textAlign: 'left',
width: '120px',
x: '45%',
y: '50px',
},
{
text: 'Returns: %plot-0-value',
bold: false,
color: '#fc8d62',
defaultValue: '',
fontSize: '14px',
fontWeight: 'bold',
textAlign: 'left',
width: '120px',
x: '70%',
y: '50px',
},
],
series: [{
text: 'returns',
values: [
1204, 1179, 1146, 1182, 1058, 1086, 1141, 1105, 1202, 992, 373, 466,
],
alphaArea: '.3',
aspect: 'spline',
backgroundColor: '#fc8d62',
dataDays: [
'Sept 19',
'Sept 20',
'Sept 21',
'Sept 22',
'Sept 23',
'Sept 24',
'Sept 25',
'Sept 26',
'Sept 27',
'Sept 28',
'Sept 29',
'Sept 30',
],
lineColor: '#fc8d62',
},
{
text: 'clicks',
values: [
1625, 1683, 1659, 1761, 1904, 1819, 1631, 1592, 1498, 1594, 1782, 1644,
],
alphaArea: '.3',
aspect: 'spline',
backgroundColor: '#66c2a5',
dataDays: [
'Sept 19',
'Sept 20',
'Sept 21',
'Sept 22',
'Sept 23',
'Sept 24',
'Sept 25',
'Sept 26',
'Sept 27',
'Sept 28',
'Sept 29',
'Sept 30',
],
lineColor: '#66c2a5',
},
{
text: 'visitors',
values: [
314, 1395, 1292, 1259, 1269, 1132, 1012, 1082, 1116, 1039, 1132, 1227,
],
alphaArea: '0.2',
aspect: 'spline',
backgroundColor: '#8da0cb',
dataDays: [
'Sept 19',
'Sept 20',
'Sept 21',
'Sept 22',
'Sept 23',
'Sept 24',
'Sept 25',
'Sept 26',
'Sept 27',
'Sept 28',
'Sept 29',
'Sept 30',
],
lineColor: '#8da0cb',
},
],
utc: true,
};
zingchart.render({
id: 'myChart',
data: chartConfig,
height: '100%',
width: '100%',
});
</script>
</body>
</html>
let chartConfig = {
  type: 'area',
  globals: {
    fontFamily: 'Roboto',
  },
  backgroundColor: '#fff',
  title: {
    text: 'Website Traffic Metrics',
    adjustLayout: true,
    backgroundColor: 'none',
    fontColor: '#05636c',
    fontSize: '24px',
    height: '25px',
    y: '15px',
  },
  plot: {
    tooltip: {
      text: 'There were %v %t on %data-days',
      borderRadius: '5px',
      fontFamily: 'Roboto',
      fontSize: '15px',
      padding: '10px',
      textAlign: 'left',
    },
    lineWidth: '2px',
    marker: {
      size: '1px',
      visible: false,
    },
  },
  plotarea: {
    adjustLayout: true,
    marginBottom: 'dynamic',
    marginLeft: 'dynamic',
    marginRight: 'dynamic',
    marginTop: '10%',
  },
  scaleX: {
    guide: {
      lineWidth: '0px',
    },
    item: {
      fontColor: '#05636c',
      textAlign: 'center',
    },
    itemsOverlap: true,
    label: {
      text: 'Date Range',
      fontSize: '14px',
      fontWeight: 'normal',
      offsetX: '10%',
    },
    labels: [
      'Sept<br>19',
      'Sept<br>20',
      'Sept<br>21',
      'Sept<br>22',
      'Sept<br>23',
      'Sept<br>24',
      'Sept<br>25',
      'Sept<br>26',
      'Sept<br>27',
      'Sept<br>28',
      'Sept<br>29',
      'Sept<br>30',
    ],
    maxItems: 12,
    maxLabels: 12,
    tick: {
      lineWidth: '2px',
    },
    zooming: true,
  },
  scaleY: {
    values: '0:2500:500',
    guide: {
      alpha: 0.2,
      lineStyle: 'dashed',
      lineWidth: '0px',
    },
    item: {
      fontColor: '#05636c',
      fontWeight: 'normal',
    },
    label: {
      text: 'Metrics',
      fontSize: '14px',
    },
  },
  crosshairX: {
    lineColor: '#898989',
    lineStyle: 'dashed',
    lineWidth: '1px',
    marker: {
      size: '4px',
      visible: true,
    },
    plotLabel: {
      visible: false,
    },
  },
  labels: [
    {
      text: 'Visitors: %plot-2-value',
      bold: false,
      color: '#8da0cb',
      defaultValue: '',
      fontSize: '14px',
      fontWeight: 'bold',
      textAlign: 'left',
      width: '120px',
      x: '20%',
      y: '50px',
    },
    {
      text: 'Clicks: %plot-1-value',
      bold: false,
      color: '#66c2a5',
      defaultValue: '',
      fontSize: '14px',
      fontWeight: 'bold',
      textAlign: 'left',
      width: '120px',
      x: '45%',
      y: '50px',
    },
    {
      text: 'Returns: %plot-0-value',
      bold: false,
      color: '#fc8d62',
      defaultValue: '',
      fontSize: '14px',
      fontWeight: 'bold',
      textAlign: 'left',
      width: '120px',
      x: '70%',
      y: '50px',
    },
  ],
  series: [
    {
      text: 'returns',
      values: [
        1204, 1179, 1146, 1182, 1058, 1086, 1141, 1105, 1202, 992, 373, 466,
      ],
      alphaArea: '.3',
      aspect: 'spline',
      backgroundColor: '#fc8d62',
      dataDays: [
        'Sept 19',
        'Sept 20',
        'Sept 21',
        'Sept 22',
        'Sept 23',
        'Sept 24',
        'Sept 25',
        'Sept 26',
        'Sept 27',
        'Sept 28',
        'Sept 29',
        'Sept 30',
      ],
      lineColor: '#fc8d62',
    },
    {
      text: 'clicks',
      values: [
        1625, 1683, 1659, 1761, 1904, 1819, 1631, 1592, 1498, 1594, 1782, 1644,
      ],
      alphaArea: '.3',
      aspect: 'spline',
      backgroundColor: '#66c2a5',
      dataDays: [
        'Sept 19',
        'Sept 20',
        'Sept 21',
        'Sept 22',
        'Sept 23',
        'Sept 24',
        'Sept 25',
        'Sept 26',
        'Sept 27',
        'Sept 28',
        'Sept 29',
        'Sept 30',
      ],
      lineColor: '#66c2a5',
    },
    {
      text: 'visitors',
      values: [
        314, 1395, 1292, 1259, 1269, 1132, 1012, 1082, 1116, 1039, 1132, 1227,
      ],
      alphaArea: '0.2',
      aspect: 'spline',
      backgroundColor: '#8da0cb',
      dataDays: [
        'Sept 19',
        'Sept 20',
        'Sept 21',
        'Sept 22',
        'Sept 23',
        'Sept 24',
        'Sept 25',
        'Sept 26',
        'Sept 27',
        'Sept 28',
        'Sept 29',
        'Sept 30',
      ],
      lineColor: '#8da0cb',
    },
  ],
  utc: true,
};

zingchart.render({
  id: 'myChart',
  data: chartConfig,
  height: '100%',
  width: '100%',
});