<!DOCTYPE html>
<html>
<head>
<meta charset="utf-8">
<title>ZingSoft Demo</title>
<script nonce="undefined" src="https://cdn.zingchart.com/zingchart.min.js"></script>
<style>
.chart--container {
min-height: 530px;
width: 100%;
height: 100%;
}
.zc-ref {
display: none;
}
</style>
</head>
<body>
<div id="myChart" class="chart--container">
<a class="zc-ref" href="https://www.zingchart.com/">Powered by ZingChart</a>
</div>
<script>
ZC.LICENSE = ["569d52cefae586f634c54f86dc99e6a9", "b55b025e438fa8a98e32482b5f768ff5"];
let chartData = [
[599, 53.8, 4900274],
[624, 58.7, 10787104],
[777, 60.4, 11178921],
[799, 60.22, 17215232],
[809, 58.3, 77266814],
[943, 62.2, 19899120],
[958, 63.9, 4503438],
[1129, 62.9, 5227791],
[1176, 56.4, 27977863],
[1225, 60.8, 12608590],
[1386, 53.4, 1844325],
[1390, 71.4, 25155317],
[1400, 64.7, 24235390],
[1433, 64.23, 7304578],
[1472, 64.1, 788474],
[1520, 63.6, 99390750],
[1549, 66.53, 11609666],
[1644, 65.1, 1990924],
[1654, 62.8, 18105570],
[1680, 60.8, 39032383],
[1684, 57.6, 17599694],
[1710, 65.3, 10711067],
[1801, 60.01, 15602751],
[1824, 62.4, 112423],
[1830, 65.5, 10879829],
[1925, 57.63, 32526562],
[2047, 64.1, 583591],
[2085, 58.5, 6453184],
[2086, 72.4, 1184765],
[2191, 57.7, 14037472],
[2251, 66.1, 15129273],
[2352, 71.2, 28513700],
[2529, 60.6, 7619321],
[2571, 63.43, 53470420],
[2582, 71, 8481855],
[2598, 48.5, 2135022],
[2897, 59.5, 23344179],
[2898, 66.63, 46050302],
[2912, 65, 264652],
[3003, 68.8, 190344],
[3047, 58, 12339812],
[3139, 64.63, 887861],
[3161, 70.1, 160995642],
[3245, 69, 5939962],
[3267, 68.4, 15577899],
[3491, 60.33, 22701556],
[3510, 67, 104460],
[3661, 65.1, 52993],
[3877, 65.7, 4067564],
[3887, 67.6, 26832215],
[3975, 69.5, 40234882],
[4012, 67.9, 53897154],
[4034, 58.96, 16211767],
[4099, 65.5, 27409893],
[4270, 72.4, 8075060],
[4319, 75.2, 4668466],
[4637, 70.26, 18502413],
[4712, 76.8, 6082032],
[4743, 66.5, 188924874],
[4896, 72.7, 4068897],
[5069, 70.5, 106170],
[5212, 66.4, 6802023],
[5558, 72.2, 193228],
[5598, 70.1, 29893488],
[5623, 76.5, 93447601],
[5727, 61.33, 182201962],
[5903, 66.8, 1311050527],
[6095, 51.5, 1286970],
[6220, 61.9, 4620330],
[6295, 72.3, 10724705],
[6514, 74.6, 520502],
[6816, 64.4, 767085],
[6876, 70.2, 100699395],
[7279, 73.1, 16342897],
[7319, 74.7, 34377511],
[7474, 73.3, 3999812],
[7615, 61, 25021974],
[7763, 74.4, 3017712],
[7776, 74.1, 6126583],
[7925, 66.3, 892145],
[7983, 70.2, 774830],
[8219, 73.9, 6639123],
[8449, 72.1, 44823765],
[8501, 70, 359287],
[8606, 75.5, 2793335],
[9833, 77.9, 3810416],
[9997, 74.5, 184999],
[10040, 61, 2458830],
[10435, 72.9, 109462],
[10503, 74.6, 72680],
[10504, 70.9, 257563815],
[10620, 76, 2896679],
[10624, 76.5, 20715010],
[10996, 75.2, 16144363],
[11031, 71.3, 91508084],
[11126, 77.3, 11253554],
[11593, 71.7, 106825],
[11752, 78.3, 7594547],
[11819, 65.3, 2959134],
[11903, 77.5, 31376670],
[12509, 63.72, 54490406],
[12547, 77, 2078453],
[12761, 75.8, 48228704],
[12837, 73.8, 10528391],
[12908, 78.1, 8850975],
[12984, 75.8, 284215],
[13334, 76.9, 1376048943],
[13434, 76.5, 39666519],
[14132, 80, 4807850],
[14408, 79.5, 363657],
[14512, 75.1, 67959359],
[14646, 72.1, 36423395],
[14833, 75.8, 625781],
[15441, 75.6, 207847528],
[15573, 78.5, 79109272],
[15753, 75.8, 31108083],
[15865, 67.9, 5373502],
[16371, 74.9, 7149787],
[16850, 74.5, 127017224],
[16986, 72.9, 9753968],
[17050, 78.5, 5850743],
[17125, 70.5, 542975],
[17196, 66.4, 2262485],
[17261, 76.2, 6278438],
[17344, 76.2, 43416755],
[17415, 70.4, 9495826],
[18350, 73.9, 1273212],
[18627, 60.53, 1725292],
[19203, 76.8, 19511324],
[19360, 76.5, 78665830],
[20260, 78, 4240317],
[20438, 77.3, 3431555],
[20485, 78.2, 3929141],
[21049, 75.2, 91818],
[21291, 78.5, 11389562],
[22465, 79.3, 17948141],
[22818, 72.3, 388019],
[23038, 73.13, 143456918],
[23282, 75.7, 1970503],
[23468, 68.2, 17625226],
[24200, 76.2, 9855023],
[24320, 75.1, 30331007],
[24787, 77.3, 38611794],
[25430, 79.8, 10954617],
[25684, 73.7, 96471],
[26437, 79.8, 10349803],
[26665, 75.4, 2878405],
[26812, 76.8, 1312558],
[27204, 76.4, 5426258],
[28550, 80.2, 2067526],
[29437, 78.6, 10543186],
[29797, 82.6, 1165300],
[30113, 71.4, 1360088],
[30265, 82.1, 418670],
[31087, 60.63, 845060],
[31590, 82.4, 8064036],
[32979, 81.7, 46121699],
[33297, 82.1, 59797685],
[34186, 80.6, 4528526],
[34644, 80.7, 50293439],
[36162, 83.5, 126573481],
[37599, 81.9, 64395345],
[38225, 81.4, 64715810],
[38923, 80.8, 5503457],
[41240, 80.4, 11299192],
[42182, 82.8, 329425],
[43294, 81.7, 35939927],
[43495, 80.1, 5669081],
[44053, 81.1, 80688545],
[44056, 81.8, 23968973],
[44138, 79.2, 1377237],
[44401, 81, 8544586],
[44892, 82, 9779426],
[45784, 80.6, 16924929],
[46577, 84.1, 70473],
[47758, 80.4, 4688465],
[48226, 75.7, 4490541],
[52469, 78.1, 31540372],
[53354, 79.1, 321773631],
[56118, 82.9, 8298663],
[60749, 76.6, 9156963],
[64304, 81.6, 5210967],
[73003, 78.7, 423188],
[80794, 82.1, 5603740],
[82633, 80.7, 3892115],
[88314, 81.1, 567110],
[132877, 82, 2235355],
];
let chartConfig = {
type: 'bubble',
title: {
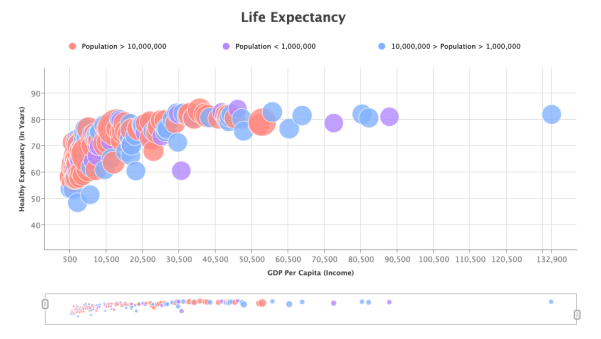
text: 'Life Expectancy',
adjustLayout: true,
},
legend: {
adjustLayout: true,
align: 'center',
borderWidth: '0px',
marker: {
type: 'circle',
},
toggleAction: 'none',
},
plot: {
tooltip: {
text: '%data-country has a population of %node-size-value <br>with a %vt year life expectancy <br> if you make %kl (GDP)',
fontSize: '15px',
rules: [{
backgroundColor: '#ff8a80',
rule: '%node-size-value >= 10000000',
},
{
backgroundColor: '#82b1ff',
rule: '%node-size-value > 1000000 && %node-size-value < 10000000',
},
{
backgroundColor: '#b388ff',
rule: '%node-size-value < 1000000',
},
],
thousandsSeparator: ',',
},
marker: {
rules: [{
alpha: 0.8,
backgroundColor: '#ff8a80',
rule: '%node-size-value >= 10000000',
},
{
alpha: 0.8,
backgroundColor: '#82b1ff',
rule: '%node-size-value > 1000000 && %node-size-value < 10000000',
},
{
alpha: 0.8,
backgroundColor: '#b388ff',
rule: '%node-size-value < 1000000',
},
],
},
},
plotarea: {
margin: 'dynamic',
},
scaleX: {
label: {
text: 'GDP Per Capita (Income)',
},
thousandsSeparator: ',',
zooming: true,
},
scaleY: {
label: {
text: 'Healthy Expectancy (In Years)',
},
maxValue: 90,
minValue: 40,
step: 5,
},
scrollX: {},
scrollY: {},
preview: {
adjustLayout: true,
},
series: [{
values: chartData,
dataCountry: [
'Central African Republic',
'Somalia',
'Burundi',
'Malawi',
'Congo, Dem. Rep.',
'Niger',
'Liberia',
'Eritrea',
'Mozambique',
'Guinea',
'Guinea-Bissau',
'North Korea',
'Madagascar',
'Togo',
'Comoros',
'Ethiopia',
'Rwanda',
'Gambia',
'Burkina Faso',
'Uganda',
'Mali',
'Haiti',
'Zimbabwe',
'Kiribati',
'Benin',
'Afghanistan',
'Solomon Islands',
'Sierra Leone',
'Timor-Leste',
'Chad',
'Senegal',
'Nepal',
'Papua New Guinea',
'Tanzania',
'Tajikistan',
'Lesotho',
'Cameroon',
'Kenya',
'Vanuatu',
'Sao Tome and Principe',
'South Sudan',
'Djibouti',
'Bangladesh',
'Kyrgyz Republic',
'Cambodia',
"Cote d'Ivoire",
'Micronesia, Fed. Sts.',
'Marshall Islands',
'Mauritania',
'Yemen',
'Sudan',
'Myanmar',
'Zambia',
'Ghana',
'Honduras',
'West Bank and Gaza',
'Syria',
'Nicaragua',
'Pakistan',
'Moldova',
'Tonga',
'Lao',
'Samoa',
'Uzbekistan',
'Vietnam',
'Nigeria',
'India',
'Swaziland',
'Congo, Rep.',
'Bolivia',
'Cape Verde',
'Guyana',
'Philippines',
'Guatemala',
'Morocco',
'Georgia',
'Angola',
'Armenia',
'El Salvador',
'Fiji',
'Bhutan',
'Paraguay',
'Ukraine',
'Belize',
'Jamaica',
'Bosnia and Herzegovina',
'St. Lucia',
'Namibia',
'St. Vincent and the Grenadines',
'Dominica',
'Indonesia',
'Albania',
'Sri Lanka',
'Ecuador',
'Egypt',
'Tunisia',
'Grenada',
'Jordan',
'Mongolia',
'Peru',
'South Africa',
'Macedonia, FYR',
'Colombia',
'Dominican Republic',
'Serbia',
'Barbados',
'China',
'Algeria',
'Costa Rica',
'Maldives',
'Thailand',
'Iraq',
'Montenegro',
'Brazil',
'Iran',
'Venezuela',
'Turkmenistan',
'Bulgaria',
'Mexico',
'Azerbaijan',
'Lebanon',
'Suriname',
'Botswana',
'Libya',
'Argentina',
'Belarus',
'Mauritius',
'Gabon',
'Romania',
'Turkey',
'Croatia',
'Uruguay',
'Panama',
'Antigua and Barbuda',
'Cuba',
'Chile',
'Bahamas',
'Russia',
'Latvia',
'Kazakhstan',
'Hungary',
'Malaysia',
'Poland',
'Greece',
'Seychelles',
'Portugal',
'Lithuania',
'Estonia',
'Slovak Republic',
'Slovenia',
'Czech Republic',
'Cyprus',
'Trinidad and Tobago',
'Malta',
'Equatorial Guinea',
'Israel',
'Spain',
'Italy',
'New Zealand',
'South Korea',
'Japan',
'France',
'United Kingdom',
'Finland',
'Belgium',
'Iceland',
'Canada',
'Denmark',
'Germany',
'Australia',
'Bahrain',
'Austria',
'Sweden',
'Netherlands',
'Andorra',
'Ireland',
'Oman',
'Saudi Arabia',
'United States',
'Switzerland',
'United Arab Emirates',
'Norway',
'Brunei',
'Singapore',
'Kuwait',
'Luxembourg',
'Qatar',
],
legendItem: {
visible: false,
},
legendMarker: {
visible: false,
},
},
{
legendItem: {
text: 'Population > 10,000,000',
},
legendMarker: {
backgroundColor: '#ff8a80',
},
},
{
legendItem: {
text: 'Population < 1,000,000',
},
legendMarker: {
backgroundColor: '#b388ff',
},
},
{
legendItem: {
text: '10,000,000 > Population > 1,000,000',
},
legendMarker: {
backgroundColor: '#82b1ff',
},
},
],
};
zingchart.render({
id: 'myChart',
data: chartConfig,
height: '100%',
width: '100%',
});
</script>
</body>
</html>
let chartData = [
  [599, 53.8, 4900274],
  [624, 58.7, 10787104],
  [777, 60.4, 11178921],
  [799, 60.22, 17215232],
  [809, 58.3, 77266814],
  [943, 62.2, 19899120],
  [958, 63.9, 4503438],
  [1129, 62.9, 5227791],
  [1176, 56.4, 27977863],
  [1225, 60.8, 12608590],
  [1386, 53.4, 1844325],
  [1390, 71.4, 25155317],
  [1400, 64.7, 24235390],
  [1433, 64.23, 7304578],
  [1472, 64.1, 788474],
  [1520, 63.6, 99390750],
  [1549, 66.53, 11609666],
  [1644, 65.1, 1990924],
  [1654, 62.8, 18105570],
  [1680, 60.8, 39032383],
  [1684, 57.6, 17599694],
  [1710, 65.3, 10711067],
  [1801, 60.01, 15602751],
  [1824, 62.4, 112423],
  [1830, 65.5, 10879829],
  [1925, 57.63, 32526562],
  [2047, 64.1, 583591],
  [2085, 58.5, 6453184],
  [2086, 72.4, 1184765],
  [2191, 57.7, 14037472],
  [2251, 66.1, 15129273],
  [2352, 71.2, 28513700],
  [2529, 60.6, 7619321],
  [2571, 63.43, 53470420],
  [2582, 71, 8481855],
  [2598, 48.5, 2135022],
  [2897, 59.5, 23344179],
  [2898, 66.63, 46050302],
  [2912, 65, 264652],
  [3003, 68.8, 190344],
  [3047, 58, 12339812],
  [3139, 64.63, 887861],
  [3161, 70.1, 160995642],
  [3245, 69, 5939962],
  [3267, 68.4, 15577899],
  [3491, 60.33, 22701556],
  [3510, 67, 104460],
  [3661, 65.1, 52993],
  [3877, 65.7, 4067564],
  [3887, 67.6, 26832215],
  [3975, 69.5, 40234882],
  [4012, 67.9, 53897154],
  [4034, 58.96, 16211767],
  [4099, 65.5, 27409893],
  [4270, 72.4, 8075060],
  [4319, 75.2, 4668466],
  [4637, 70.26, 18502413],
  [4712, 76.8, 6082032],
  [4743, 66.5, 188924874],
  [4896, 72.7, 4068897],
  [5069, 70.5, 106170],
  [5212, 66.4, 6802023],
  [5558, 72.2, 193228],
  [5598, 70.1, 29893488],
  [5623, 76.5, 93447601],
  [5727, 61.33, 182201962],
  [5903, 66.8, 1311050527],
  [6095, 51.5, 1286970],
  [6220, 61.9, 4620330],
  [6295, 72.3, 10724705],
  [6514, 74.6, 520502],
  [6816, 64.4, 767085],
  [6876, 70.2, 100699395],
  [7279, 73.1, 16342897],
  [7319, 74.7, 34377511],
  [7474, 73.3, 3999812],
  [7615, 61, 25021974],
  [7763, 74.4, 3017712],
  [7776, 74.1, 6126583],
  [7925, 66.3, 892145],
  [7983, 70.2, 774830],
  [8219, 73.9, 6639123],
  [8449, 72.1, 44823765],
  [8501, 70, 359287],
  [8606, 75.5, 2793335],
  [9833, 77.9, 3810416],
  [9997, 74.5, 184999],
  [10040, 61, 2458830],
  [10435, 72.9, 109462],
  [10503, 74.6, 72680],
  [10504, 70.9, 257563815],
  [10620, 76, 2896679],
  [10624, 76.5, 20715010],
  [10996, 75.2, 16144363],
  [11031, 71.3, 91508084],
  [11126, 77.3, 11253554],
  [11593, 71.7, 106825],
  [11752, 78.3, 7594547],
  [11819, 65.3, 2959134],
  [11903, 77.5, 31376670],
  [12509, 63.72, 54490406],
  [12547, 77, 2078453],
  [12761, 75.8, 48228704],
  [12837, 73.8, 10528391],
  [12908, 78.1, 8850975],
  [12984, 75.8, 284215],
  [13334, 76.9, 1376048943],
  [13434, 76.5, 39666519],
  [14132, 80, 4807850],
  [14408, 79.5, 363657],
  [14512, 75.1, 67959359],
  [14646, 72.1, 36423395],
  [14833, 75.8, 625781],
  [15441, 75.6, 207847528],
  [15573, 78.5, 79109272],
  [15753, 75.8, 31108083],
  [15865, 67.9, 5373502],
  [16371, 74.9, 7149787],
  [16850, 74.5, 127017224],
  [16986, 72.9, 9753968],
  [17050, 78.5, 5850743],
  [17125, 70.5, 542975],
  [17196, 66.4, 2262485],
  [17261, 76.2, 6278438],
  [17344, 76.2, 43416755],
  [17415, 70.4, 9495826],
  [18350, 73.9, 1273212],
  [18627, 60.53, 1725292],
  [19203, 76.8, 19511324],
  [19360, 76.5, 78665830],
  [20260, 78, 4240317],
  [20438, 77.3, 3431555],
  [20485, 78.2, 3929141],
  [21049, 75.2, 91818],
  [21291, 78.5, 11389562],
  [22465, 79.3, 17948141],
  [22818, 72.3, 388019],
  [23038, 73.13, 143456918],
  [23282, 75.7, 1970503],
  [23468, 68.2, 17625226],
  [24200, 76.2, 9855023],
  [24320, 75.1, 30331007],
  [24787, 77.3, 38611794],
  [25430, 79.8, 10954617],
  [25684, 73.7, 96471],
  [26437, 79.8, 10349803],
  [26665, 75.4, 2878405],
  [26812, 76.8, 1312558],
  [27204, 76.4, 5426258],
  [28550, 80.2, 2067526],
  [29437, 78.6, 10543186],
  [29797, 82.6, 1165300],
  [30113, 71.4, 1360088],
  [30265, 82.1, 418670],
  [31087, 60.63, 845060],
  [31590, 82.4, 8064036],
  [32979, 81.7, 46121699],
  [33297, 82.1, 59797685],
  [34186, 80.6, 4528526],
  [34644, 80.7, 50293439],
  [36162, 83.5, 126573481],
  [37599, 81.9, 64395345],
  [38225, 81.4, 64715810],
  [38923, 80.8, 5503457],
  [41240, 80.4, 11299192],
  [42182, 82.8, 329425],
  [43294, 81.7, 35939927],
  [43495, 80.1, 5669081],
  [44053, 81.1, 80688545],
  [44056, 81.8, 23968973],
  [44138, 79.2, 1377237],
  [44401, 81, 8544586],
  [44892, 82, 9779426],
  [45784, 80.6, 16924929],
  [46577, 84.1, 70473],
  [47758, 80.4, 4688465],
  [48226, 75.7, 4490541],
  [52469, 78.1, 31540372],
  [53354, 79.1, 321773631],
  [56118, 82.9, 8298663],
  [60749, 76.6, 9156963],
  [64304, 81.6, 5210967],
  [73003, 78.7, 423188],
  [80794, 82.1, 5603740],
  [82633, 80.7, 3892115],
  [88314, 81.1, 567110],
  [132877, 82, 2235355],
];

let chartConfig = {
  type: 'bubble',
  title: {
    text: 'Life Expectancy',
    adjustLayout: true,
  },
  legend: {
    adjustLayout: true,
    align: 'center',
    borderWidth: '0px',
    marker: {
      type: 'circle',
    },
    toggleAction: 'none',
  },
  plot: {
    tooltip: {
      text: '%data-country has a population of %node-size-value <br>with a %vt year life expectancy <br> if you make %kl (GDP)',
      fontSize: '15px',
      rules: [
        {
          backgroundColor: '#ff8a80',
          rule: '%node-size-value >= 10000000',
        },
        {
          backgroundColor: '#82b1ff',
          rule: '%node-size-value > 1000000 && %node-size-value < 10000000',
        },
        {
          backgroundColor: '#b388ff',
          rule: '%node-size-value < 1000000',
        },
      ],
      thousandsSeparator: ',',
    },
    marker: {
      rules: [
        {
          alpha: 0.8,
          backgroundColor: '#ff8a80',
          rule: '%node-size-value >= 10000000',
        },
        {
          alpha: 0.8,
          backgroundColor: '#82b1ff',
          rule: '%node-size-value > 1000000 && %node-size-value < 10000000',
        },
        {
          alpha: 0.8,
          backgroundColor: '#b388ff',
          rule: '%node-size-value < 1000000',
        },
      ],
    },
  },
  plotarea: {
    margin: 'dynamic',
  },
  scaleX: {
    label: {
      text: 'GDP Per Capita (Income)',
    },
    thousandsSeparator: ',',
    zooming: true,
  },
  scaleY: {
    label: {
      text: 'Healthy Expectancy (In Years)',
    },
    maxValue: 90,
    minValue: 40,
    step: 5,
  },
  scrollX: {},
  scrollY: {},
  preview: {
    adjustLayout: true,
  },
  series: [
    {
      values: chartData,
      dataCountry: [
        'Central African Republic',
        'Somalia',
        'Burundi',
        'Malawi',
        'Congo, Dem. Rep.',
        'Niger',
        'Liberia',
        'Eritrea',
        'Mozambique',
        'Guinea',
        'Guinea-Bissau',
        'North Korea',
        'Madagascar',
        'Togo',
        'Comoros',
        'Ethiopia',
        'Rwanda',
        'Gambia',
        'Burkina Faso',
        'Uganda',
        'Mali',
        'Haiti',
        'Zimbabwe',
        'Kiribati',
        'Benin',
        'Afghanistan',
        'Solomon Islands',
        'Sierra Leone',
        'Timor-Leste',
        'Chad',
        'Senegal',
        'Nepal',
        'Papua New Guinea',
        'Tanzania',
        'Tajikistan',
        'Lesotho',
        'Cameroon',
        'Kenya',
        'Vanuatu',
        'Sao Tome and Principe',
        'South Sudan',
        'Djibouti',
        'Bangladesh',
        'Kyrgyz Republic',
        'Cambodia',
        "Cote d'Ivoire",
        'Micronesia, Fed. Sts.',
        'Marshall Islands',
        'Mauritania',
        'Yemen',
        'Sudan',
        'Myanmar',
        'Zambia',
        'Ghana',
        'Honduras',
        'West Bank and Gaza',
        'Syria',
        'Nicaragua',
        'Pakistan',
        'Moldova',
        'Tonga',
        'Lao',
        'Samoa',
        'Uzbekistan',
        'Vietnam',
        'Nigeria',
        'India',
        'Swaziland',
        'Congo, Rep.',
        'Bolivia',
        'Cape Verde',
        'Guyana',
        'Philippines',
        'Guatemala',
        'Morocco',
        'Georgia',
        'Angola',
        'Armenia',
        'El Salvador',
        'Fiji',
        'Bhutan',
        'Paraguay',
        'Ukraine',
        'Belize',
        'Jamaica',
        'Bosnia and Herzegovina',
        'St. Lucia',
        'Namibia',
        'St. Vincent and the Grenadines',
        'Dominica',
        'Indonesia',
        'Albania',
        'Sri Lanka',
        'Ecuador',
        'Egypt',
        'Tunisia',
        'Grenada',
        'Jordan',
        'Mongolia',
        'Peru',
        'South Africa',
        'Macedonia, FYR',
        'Colombia',
        'Dominican Republic',
        'Serbia',
        'Barbados',
        'China',
        'Algeria',
        'Costa Rica',
        'Maldives',
        'Thailand',
        'Iraq',
        'Montenegro',
        'Brazil',
        'Iran',
        'Venezuela',
        'Turkmenistan',
        'Bulgaria',
        'Mexico',
        'Azerbaijan',
        'Lebanon',
        'Suriname',
        'Botswana',
        'Libya',
        'Argentina',
        'Belarus',
        'Mauritius',
        'Gabon',
        'Romania',
        'Turkey',
        'Croatia',
        'Uruguay',
        'Panama',
        'Antigua and Barbuda',
        'Cuba',
        'Chile',
        'Bahamas',
        'Russia',
        'Latvia',
        'Kazakhstan',
        'Hungary',
        'Malaysia',
        'Poland',
        'Greece',
        'Seychelles',
        'Portugal',
        'Lithuania',
        'Estonia',
        'Slovak Republic',
        'Slovenia',
        'Czech Republic',
        'Cyprus',
        'Trinidad and Tobago',
        'Malta',
        'Equatorial Guinea',
        'Israel',
        'Spain',
        'Italy',
        'New Zealand',
        'South Korea',
        'Japan',
        'France',
        'United Kingdom',
        'Finland',
        'Belgium',
        'Iceland',
        'Canada',
        'Denmark',
        'Germany',
        'Australia',
        'Bahrain',
        'Austria',
        'Sweden',
        'Netherlands',
        'Andorra',
        'Ireland',
        'Oman',
        'Saudi Arabia',
        'United States',
        'Switzerland',
        'United Arab Emirates',
        'Norway',
        'Brunei',
        'Singapore',
        'Kuwait',
        'Luxembourg',
        'Qatar',
      ],
      legendItem: {
        visible: false,
      },
      legendMarker: {
        visible: false,
      },
    },
    {
      legendItem: {
        text: 'Population > 10,000,000',
      },
      legendMarker: {
        backgroundColor: '#ff8a80',
      },
    },
    {
      legendItem: {
        text: 'Population < 1,000,000',
      },
      legendMarker: {
        backgroundColor: '#b388ff',
      },
    },
    {
      legendItem: {
        text: '10,000,000 > Population > 1,000,000',
      },
      legendMarker: {
        backgroundColor: '#82b1ff',
      },
    },
  ],
};

zingchart.render({
  id: 'myChart',
  data: chartConfig,
  height: '100%',
  width: '100%',
});