<!DOCTYPE html>
<html>
<head>
<meta charset="utf-8">
<title>ZingSoft Demo</title>
<script nonce="undefined" src="https://cdn.zingchart.com/zingchart.min.js"></script>
<style>
.chart--container {
min-height: 530px;
width: 100%;
height: 100%;
}
.zc-ref {
display: none;
}
</style>
</head>
<body>
<div id="myChart" class="chart--container">
<a class="zc-ref" href="https://www.zingchart.com/">Powered by ZingChart</a>
</div>
<script>
ZC.LICENSE = ["569d52cefae586f634c54f86dc99e6a9", "b55b025e438fa8a98e32482b5f768ff5"];
let chartConfig = {
type: 'heatmap',
alpha: 0.75,
backgroundFit: 'xy',
backgroundImage: 'https://app.zingsoft.com/api/file/IHSVIUB2/cloudy-sky.jpg',
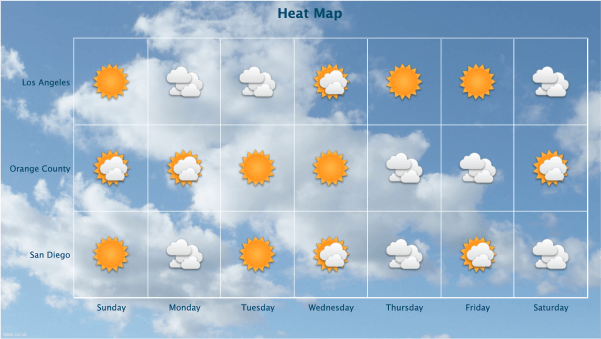
title: {
text: 'Heat Map',
fontColor: '#024567',
},
plot: {
tooltip: {
text: '%kl will be<br>%data-weather<br>in %y!',
alpha: 0.9,
backgroundColor: 'white',
fontColor: '#006699',
fontFamily: 'Georgia',
fontSize: '13px',
},
aspect: 'none',
backgroundColor: 'none',
backgroundRepeat: false,
hoverState: {
backgroundColor: '#006699',
},
rules: [{
backgroundImage: 'https://www.zingchart.com/resources/sunny.png',
rule: '%v == 1',
},
{
backgroundImage: 'https://www.zingchart.com/resources/partly-cloudy.png',
rule: '%v == 2',
},
{
backgroundImage: 'https://www.zingchart.com/resources/cloudy.png',
rule: '%v == 3',
},
],
},
plotarea: {
marginLeft: 'dynamic',
border: '1px solid #FFF',
},
scaleX: {
guide: {
lineColor: '#FFF',
lineStyle: 'solid',
},
item: {
fontColor: '#024567',
fontSize: '13px',
},
labels: [
'Sunday',
'Monday',
'Tuesday',
'Wednesday',
'Thursday',
'Friday',
'Saturday',
],
lineColor: 'none',
tick: {
visible: false,
},
},
scaleY: {
guide: {
lineColor: '#FFF',
lineStyle: 'solid',
},
item: {
fontColor: '#024567',
fontSize: '13px',
},
labels: ['San Diego', 'Orange County', 'Los Angeles'],
lineColor: 'none',
tick: {
visible: false,
},
},
series: [{
values: [1, 3, 1, 2, 3, 2, 3],
dataWeather: [
'sunny',
'cloudy',
'sunny',
'partly cloudy',
'cloudy',
'partly cloudy',
'cloudy',
],
},
{
values: [2, 2, 1, 1, 3, 3, 2],
dataWeather: [
'partly cloudy',
'partly cloudy',
'sunny',
'sunny',
'cloudy',
'cloudy',
'partly cloudy',
],
},
{
values: [1, 3, 3, 2, 1, 1, 3],
dataWeather: [
'sunny',
'cloudy',
'cloudy',
'partly cloudy',
'sunny',
'sunny',
'cloudy',
],
},
],
};
zingchart.render({
id: 'myChart',
data: chartConfig,
width: '100%',
height: '530px',
});
</script>
</body>
</html>
let chartConfig = {
  type: 'heatmap',
  alpha: 0.75,
  backgroundFit: 'xy',
  backgroundImage: 'https://app.zingsoft.com/api/file/IHSVIUB2/cloudy-sky.jpg',
  title: {
    text: 'Heat Map',
    fontColor: '#024567',
  },
  plot: {
    tooltip: {
      text: '%kl will be<br>%data-weather<br>in %y!',
      alpha: 0.9,
      backgroundColor: 'white',
      fontColor: '#006699',
      fontFamily: 'Georgia',
      fontSize: '13px',
    },
    aspect: 'none',
    backgroundColor: 'none',
    backgroundRepeat: false,
    hoverState: {
      backgroundColor: '#006699',
    },
    rules: [
      {
        backgroundImage: 'https://www.zingchart.com/resources/sunny.png',
        rule: '%v == 1',
      },
      {
        backgroundImage:
          'https://www.zingchart.com/resources/partly-cloudy.png',
        rule: '%v == 2',
      },
      {
        backgroundImage: 'https://www.zingchart.com/resources/cloudy.png',
        rule: '%v == 3',
      },
    ],
  },
  plotarea: {
    marginLeft: 'dynamic',
    border: '1px solid #FFF',
  },
  scaleX: {
    guide: {
      lineColor: '#FFF',
      lineStyle: 'solid',
    },
    item: {
      fontColor: '#024567',
      fontSize: '13px',
    },
    labels: [
      'Sunday',
      'Monday',
      'Tuesday',
      'Wednesday',
      'Thursday',
      'Friday',
      'Saturday',
    ],
    lineColor: 'none',
    tick: {
      visible: false,
    },
  },
  scaleY: {
    guide: {
      lineColor: '#FFF',
      lineStyle: 'solid',
    },
    item: {
      fontColor: '#024567',
      fontSize: '13px',
    },
    labels: ['San Diego', 'Orange County', 'Los Angeles'],
    lineColor: 'none',
    tick: {
      visible: false,
    },
  },
  series: [
    {
      values: [1, 3, 1, 2, 3, 2, 3],
      dataWeather: [
        'sunny',
        'cloudy',
        'sunny',
        'partly cloudy',
        'cloudy',
        'partly cloudy',
        'cloudy',
      ],
    },
    {
      values: [2, 2, 1, 1, 3, 3, 2],
      dataWeather: [
        'partly cloudy',
        'partly cloudy',
        'sunny',
        'sunny',
        'cloudy',
        'cloudy',
        'partly cloudy',
      ],
    },
    {
      values: [1, 3, 3, 2, 1, 1, 3],
      dataWeather: [
        'sunny',
        'cloudy',
        'cloudy',
        'partly cloudy',
        'sunny',
        'sunny',
        'cloudy',
      ],
    },
  ],
};

zingchart.render({
  id: 'myChart',
  data: chartConfig,
  width: '100%',
  height: '530px',
});