<!doctype html>
<html class="zc-html">
<head>
<meta charset="utf-8">
<title>ZingSoft Demo</title>
<script nonce="undefined" src="https://cdn.zingchart.com/zingchart.min.js"></script>
<style>
.zc-body {
background: #fff;
}
.chart--container {
height: 100%;
width: 100%;
min-height: 530px;
}
.zc-ref {
display: none;
}
</style>
</head>
<body class="zc-body">
<div id="myChart" class="chart--container">
<a href="https://www.zingchart.com/" rel="noopener" class="zc-ref">Powered by ZingChart</a>
</div>
<script>
ZC.LICENSE = ["569d52cefae586f634c54f86dc99e6a9", "b55b025e438fa8a98e32482b5f768ff5"]; // HELPER METHODS
// -----------------------------
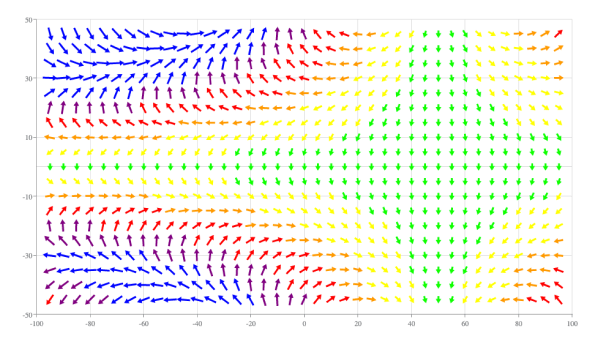
window.vectorplot_data = function(p) {
let x, y, length, direction, color;
let vdata = [];
let szx = [-100, 100],
szy = [-50, 50];
for (x = szx[0] + 5; x < szx[1]; x += 5) {
for (y = szy[0] + 5; y < szy[1]; y += 5) {
length = 50 + Math.abs(Math.round(Math.sin(((50 - x) * y) / 3000) * Math.cos((x + y) / 200) * 150));
direction = Math.round(Math.sin(((50 - x) * y) / 5000) * Math.cos((x + y) / 400) * 360);
color = '#000000';
if (length >= 50 && length < 70) {
color = '#00FF00';
} else if (length >= 70 && length < 100) {
color = '#FFFF00';
} else if (length >= 100 && length < 120) {
color = '#FF9900';
} else if (length >= 120 && length < 150) {
color = '#FF0000';
} else if (length >= 150 && length < 170) {
color = '#800080';
} else {
color = '#0000FF';
}
vdata.push([
x,
y,
length,
direction,
color
]);
}
}
return vdata;
};
// DEFINE DATA
// -----------------------------
let vData = vectorplot_data(1, 2, 3);
// CHART CONFIG
// -----------------------------
let chartConfig = {
globals: {
fontFamily: 'Lucida Sans Unicode'
},
type: 'vectorplot',
plotarea: {
margin: 'dynamic'
},
scaleX: {
values: '-100:100:10',
guide: {
lineStyle: 'solid'
},
offset: 0
},
scaleY: {
values: '-50:50:10',
guide: {
lineStyle: 'solid'
},
offset: 0,
},
options: {
arrow: {
minLength: '6px',
maxLength: '12px',
style: {
size: '3px'
}
},
data: vData
},
tooltip: {
align: 'left',
alpha: 0.85,
backgroundColor: '#fff',
borderColor: '#999',
borderRadius: '7px',
borderWidth: '1px',
callout: true,
calloutWidth: '12px',
color: '#000',
fontSize: '13px',
padding: '15px',
placement: 'vertical'
}
};
// RENDER CHARTS
// -----------------------------
zingchart.render({
id: 'myChart',
data: chartConfig,
height: '100%',
width: '100%'
});
</script>
</body>
</html>
// HELPER METHODS
// -----------------------------
window.vectorplot_data = function (p) {
  let x, y, length, direction, color;
  let vdata = [];
  let szx = [-100, 100], szy = [-50, 50];
  for (x = szx[0] + 5; x < szx[1]; x += 5) {
    for (y = szy[0] + 5; y < szy[1]; y += 5) {
      length = 50 + Math.abs(Math.round(Math.sin(((50 - x) * y) / 3000) * Math.cos((x + y) / 200) * 150));
      direction = Math.round(Math.sin(((50 - x) * y) / 5000) * Math.cos((x + y) / 400) * 360);
      color = '#000000';
      if (length >= 50 && length < 70) {
        color = '#00FF00';
      } else if (length >= 70 && length < 100) {
        color = '#FFFF00';
      } else if (length >= 100 && length < 120) {
        color = '#FF9900';
      } else if (length >= 120 && length < 150) {
        color = '#FF0000';
      } else if (length >= 150 && length < 170) {
        color = '#800080';
      } else {
        color = '#0000FF';
      }
      vdata.push([
        x,
        y,
        length,
        direction,
        color
      ]);
    }
  }
  return vdata;
};

// DEFINE DATA
// -----------------------------
let vData = vectorplot_data(1, 2, 3);

// CHART CONFIG
// -----------------------------
let chartConfig = {
  globals: {
    fontFamily: 'Lucida Sans Unicode'
  },
  type: 'vectorplot',
  plotarea: {
    margin: 'dynamic'
  },
  scaleX: {
    values: '-100:100:10',
    guide: {
      lineStyle: 'solid'
    },
    offset: 0
  },
  scaleY: {
    values: '-50:50:10',
    guide: {
      lineStyle: 'solid'
    },
    offset: 0,
  },
  options: {
    arrow: {
      minLength: '6px',
      maxLength: '12px',
      style: {
        size: '3px'
      }
    },
    data: vData
  },
  tooltip: {
    align: 'left',
    alpha: 0.85,
    backgroundColor: '#fff',
    borderColor: '#999',
    borderRadius: '7px',
    borderWidth: '1px',
    callout: true,
    calloutWidth: '12px',
    color: '#000',
    fontSize: '13px',
    padding: '15px',
    placement: 'vertical'
  }
};

// RENDER CHARTS
// -----------------------------
zingchart.render({
  id: 'myChart',
  data: chartConfig,
  height: '100%',
  width: '100%'
});