<!DOCTYPE html>
<html>
<head>
<meta charset="utf-8">
<title>ZingSoft Demo</title>
<script nonce="undefined" src="https://cdn.zingchart.com/zingchart.min.js"></script>
<style>
.chart--container {
min-height: 530px;
width: 100%;
height: 100%;
}
.zc-ref {
display: none;
}
</style>
</head>
<body>
<div id="myChart" class="chart--container">
<a class="zc-ref" href="https://www.zingchart.com/">Powered by ZingChart</a>
</div>
<script>
ZC.LICENSE = ["569d52cefae586f634c54f86dc99e6a9", "b55b025e438fa8a98e32482b5f768ff5"];
let chartConfig = {
gui: {
behaviors: [{
id: 'DownloadPDF',
enabled: 'none',
},
{
id: 'CrosshairHide',
enabled: 'none',
},
{
id: 'Reload',
enabled: 'none',
},
{
id: 'SaveAsImage',
enabled: 'none',
},
{
id: 'DownloadSVG',
enabled: 'none',
},
{
id: 'Print',
enabled: 'none',
},
{
id: 'LogScale',
enabled: 'none',
},
{
id: 'ViewSource',
enabled: 'none',
},
{
id: 'FullScreen',
enabled: 'none',
},
{
id: 'ZoomIn',
enabled: 'none',
},
{
id: 'ZoomOut',
enabled: 'none',
},
{
id: 'ViewAll',
enabled: 'none',
},
{
id: 'About',
enabled: 'none',
},
],
},
graphset: [{
type: 'area',
title: {
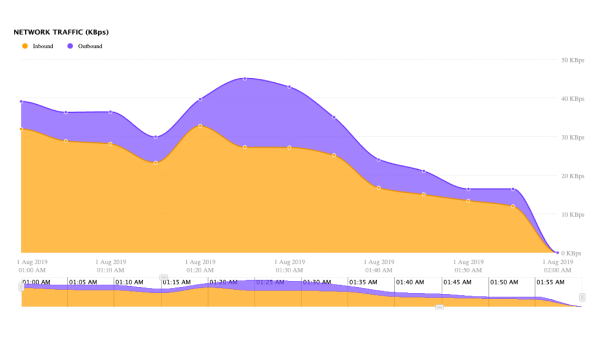
text: 'NETWORK TRAFFIC (KBps)',
marginTop: '5px',
marginLeft: '15px',
backgroundColor: 'transparent',
color: 'black',
fontSize: '13pt',
position: '0px 0px',
textAlign: 'left',
},
legend: {
align: 'left',
marginTop: '30px',
backgroundColor: 'none',
borderWidth: '0px',
item: {
fontFamily: 'Roboto',
},
layout: 'x4',
marker: {
type: 'circle',
borderColor: 'transparent',
size: '5px',
},
shadow: false,
toggleAction: 'remove',
verticalAlign: 'top',
},
plot: {
tooltip: {
text: '<div style="text-align: center; line-height: 14px; padding-top: 5px;"><b>%t</b><br><br>%kt<br><br><b>Traffic: %node-value KBps</b></div>',
fontFamily: 'Roboto',
htmlMode: true,
marginTop: '5px',
padding: '5px 15px',
},
activeArea: true,
alphaArea: 0.7,
aspect: 'spline',
marker: {
borderColor: '#ffffff',
shadow: false,
size: '3px',
},
shadow: false,
stacked: true,
},
plotarea: {
marginLeft: '20px',
marginRight: '65px',
marginTop: '70px',
},
scaleX: {
values: [
1564646407000, 1564646707000, 1564647007000, 1564647307000, 1564647607000,
1564647907000, 1564648207000, 1564648507000, 1564648807000, 1564649107000,
1564649407000, 1564649707000, 1564650007000,
],
guide: {
visible: false,
},
item: {
fontColor: '#acacac',
fontFamily: 'Roboto',
offsetY: '2px',
rules: [{
offsetX: '20px',
rule: '%scale-position === 0',
}, ],
},
lineWidth: '0px',
tick: {
visible: false,
},
transform: {
type: 'date',
all: '%d %M %Y<br>%h:%i %A',
},
zooming: true,
},
scaleY: {
format: '%v KBps',
guide: {
lineStyle: 'dotted',
},
item: {
fontColor: '#acacac',
fontFamily: 'Roboto',
},
lineWidth: '0px',
placement: 'opposite',
tick: {
visible: false,
},
zooming: true,
},
zoom: {
preserveZoom: true, // saves state so appears to not reload
},
preview: {
alpha: 0.2,
borderColor: '#aeaeae',
borderWidth: '1px',
handleBottom: {
borderColor: '#ccc',
borderWidth: '1px',
},
handleLeft: {
borderColor: '#ccc',
borderWidth: '1px',
},
handleRight: {
borderColor: '#ccc',
borderWidth: '1px',
},
handleTop: {
borderColor: '#ccc',
borderWidth: '1px',
},
height: '55px',
live: true,
marginBottom: '5px',
marginLeft: '20px',
marginRight: '20px',
mask: {
backgroundColor: '#c7c7c7',
},
preserveZoom: true,
},
series: [{
text: 'Inbound',
values: [
32.0226, 28.9014, 28.1703, 23.3206, 32.8237, 27.3159, 27.2535, 25.1924,
16.7938, 15.0575, 13.4819, 12.0279, 0.009,
],
backgroundColor: '#FFA000', // yellow
lineColor: '#e58f00',
marker: {
backgroundColor: '#FFA000',
},
palette: 0,
},
{
text: 'Outbound',
values: [
7.1359, 7.4406, 8.2906, 6.6474, 6.8506, 17.8208, 15.6422, 9.8198,
7.3635, 6.0869, 3.0183, 4.4826, 0.0155,
],
backgroundColor: '#7C4DFF',
lineColor: '#6a34ff',
marker: {
backgroundColor: '#7C4DFF',
},
palette: 1,
},
],
}],
};
zingchart.render({
id: 'myChart',
data: chartConfig,
output: 'svg',
height: '100%',
width: '100%',
});
</script>
</body>
</html>
let chartConfig = {
  gui: {
    behaviors: [
      {
        id: 'DownloadPDF',
        enabled: 'none',
      },
      {
        id: 'CrosshairHide',
        enabled: 'none',
      },
      {
        id: 'Reload',
        enabled: 'none',
      },
      {
        id: 'SaveAsImage',
        enabled: 'none',
      },
      {
        id: 'DownloadSVG',
        enabled: 'none',
      },
      {
        id: 'Print',
        enabled: 'none',
      },
      {
        id: 'LogScale',
        enabled: 'none',
      },
      {
        id: 'ViewSource',
        enabled: 'none',
      },
      {
        id: 'FullScreen',
        enabled: 'none',
      },
      {
        id: 'ZoomIn',
        enabled: 'none',
      },
      {
        id: 'ZoomOut',
        enabled: 'none',
      },
      {
        id: 'ViewAll',
        enabled: 'none',
      },
      {
        id: 'About',
        enabled: 'none',
      },
    ],
  },
  graphset: [{
    type: 'area',
    title: {
      text: 'NETWORK TRAFFIC (KBps)',
      marginTop: '5px',
      marginLeft: '15px',
      backgroundColor: 'transparent',
      color: 'black',
      fontSize: '13pt',
      position: '0px 0px',
      textAlign: 'left',
    },
    legend: {
      align: 'left',
      marginTop: '30px',
      backgroundColor: 'none',
      borderWidth: '0px',
      item: {
        fontFamily: 'Roboto',
      },
      layout: 'x4',
      marker: {
        type: 'circle',
        borderColor: 'transparent',
        size: '5px',
      },
      shadow: false,
      toggleAction: 'remove',
      verticalAlign: 'top',
    },
    plot: {
      tooltip: {
        text: '<div style="text-align: center; line-height: 14px; padding-top: 5px;"><b>%t</b><br><br>%kt<br><br><b>Traffic: %node-value KBps</b></div>',
        fontFamily: 'Roboto',
        htmlMode: true,
        marginTop: '5px',
        padding: '5px 15px',
      },
      activeArea: true,
      alphaArea: 0.7,
      aspect: 'spline',
      marker: {
        borderColor: '#ffffff',
        shadow: false,
        size: '3px',
      },
      shadow: false,
      stacked: true,
    },
    plotarea: {
      marginLeft: '20px',
      marginRight: '65px',
      marginTop: '70px',
    },
    scaleX: {
      values: [
        1564646407000, 1564646707000, 1564647007000, 1564647307000, 1564647607000,
        1564647907000, 1564648207000, 1564648507000, 1564648807000, 1564649107000,
        1564649407000, 1564649707000, 1564650007000,
      ],
      guide: {
        visible: false,
      },
      item: {
        fontColor: '#acacac',
        fontFamily: 'Roboto',
        offsetY: '2px',
        rules: [
          {
            offsetX: '20px',
            rule: '%scale-position === 0',
          },
        ],
      },
      lineWidth: '0px',
      tick: {
        visible: false,
      },
      transform: {
        type: 'date',
        all: '%d %M %Y<br>%h:%i %A',
      },
      zooming: true,
    },
    scaleY: {
      format: '%v KBps',
      guide: {
        lineStyle: 'dotted',
      },
      item: {
        fontColor: '#acacac',
        fontFamily: 'Roboto',
      },
      lineWidth: '0px',
      placement: 'opposite',
      tick: {
        visible: false,
      },
      zooming: true,
    },
    zoom: {
      preserveZoom: true, // saves state so appears to not reload
    },
    preview: {
      alpha: 0.2,
      borderColor: '#aeaeae',
      borderWidth: '1px',
      handleBottom: {
        borderColor: '#ccc',
        borderWidth: '1px',
      },
      handleLeft: {
        borderColor: '#ccc',
        borderWidth: '1px',
      },
      handleRight: {
        borderColor: '#ccc',
        borderWidth: '1px',
      },
      handleTop: {
        borderColor: '#ccc',
        borderWidth: '1px',
      },
      height: '55px',
      live: true,
      marginBottom: '5px',
      marginLeft: '20px',
      marginRight: '20px',
      mask: {
        backgroundColor: '#c7c7c7',
      },
      preserveZoom: true,
    },
    series: [
      {
        text: 'Inbound',
        values: [
          32.0226, 28.9014, 28.1703, 23.3206, 32.8237, 27.3159, 27.2535, 25.1924,
          16.7938, 15.0575, 13.4819, 12.0279, 0.009,
        ],
        backgroundColor: '#FFA000', // yellow
        lineColor: '#e58f00',
        marker: {
          backgroundColor: '#FFA000',
        },
        palette: 0,
      },
      {
        text: 'Outbound',
        values: [
          7.1359, 7.4406, 8.2906, 6.6474, 6.8506, 17.8208, 15.6422, 9.8198,
          7.3635, 6.0869, 3.0183, 4.4826, 0.0155,
        ],
        backgroundColor: '#7C4DFF',
        lineColor: '#6a34ff',
        marker: {
          backgroundColor: '#7C4DFF',
        },
        palette: 1,
      },
    ],
  }],
};

zingchart.render({
  id: 'myChart',
  data: chartConfig,
  output: 'svg',
  height: '100%',
  width: '100%',
});