<!doctype html>
<html class="zc-html">
<head>
<meta charset="utf-8">
<title>ZingSoft Demo</title>
<script nonce="undefined" src="https://cdn.zingchart.com/zingchart.min.js"></script>
<style>
.chart--container {
height: 100%;
width: 100%;
min-height: 530px;
}
.zc-ref {
display: none;
}
</style>
</head>
<body class="zc-body">
<div id="myChart" class="chart--container">
<a href="https://www.zingchart.com/" rel="noopener" class="zc-ref">Powered by ZingChart</a>
</div>
<script>
ZC.LICENSE = ["569d52cefae586f634c54f86dc99e6a9", "b55b025e438fa8a98e32482b5f768ff5"]; // CHART CONFIG
// -----------------------------
let myConfig = {
shapes: [{
type: 'zingchart.maps',
options: {
name: 'usa',
scrolling: false,
style: {
label: {
visible: false
},
items: {
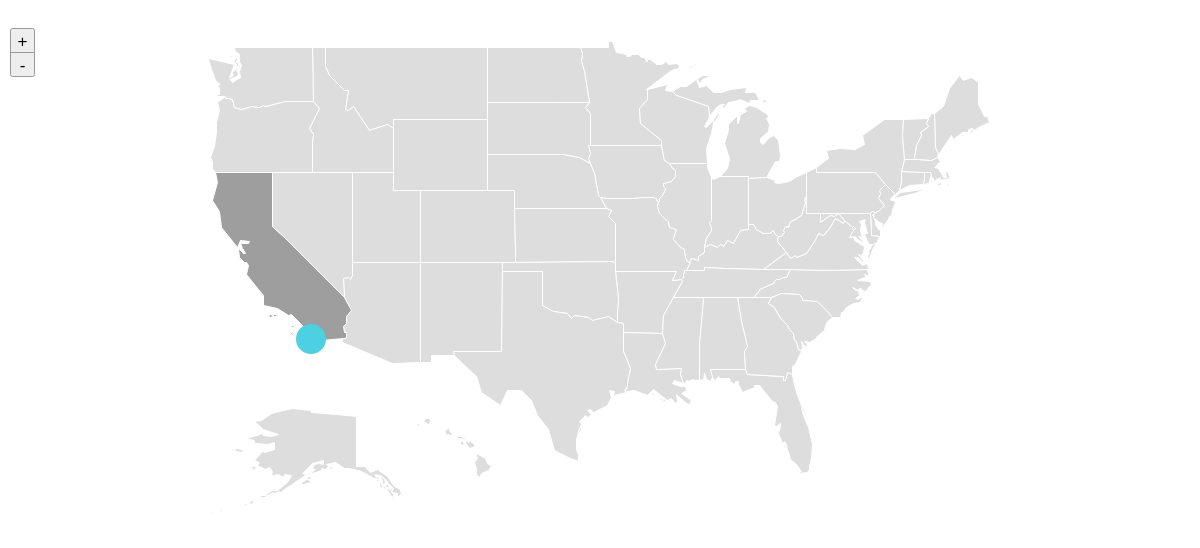
CA: {
backgroundColor: '#9e9e9e'
}
}
}
}
},
{
type: 'circle', // shapeid is OPTIONAL but smart if you are targeting events to this shape
id: 'sd',
map: 'usa', // assigning to map name or id is necessary
backgroundColor: '#4dd0e1',
cursor: 'pointer',
size: 15,
target: '_blank', // just like HTMl we have
url: 'https://en.wikipedia.org/wiki/Anchorman:_The_Legend_of_Ron_Burgundy', // is how you link url to shapestarget _blank
x: '-117.1611lon', // hook shape based on lon/lat
y: '32.7157lat', // hook shape based on lon/lat
tooltip: {
text: 'We\'re located right in San Diego!',
backgroundColor: '#ff9800',
borderColor: '#333',
borderRadius: 4,
fontSize: 16
}
}
]
};
// EVENTS
// -----------------------------
zingchart.bind(null, 'shape_click', function(e) {
if (e.shapeid === 'sd')
console.log(e)
});
// RENDER CHARTS
// -----------------------------
zingchart.loadModules('maps, maps-usa', function() {
zingchart.render({
id: 'myChart',
data: myConfig,
height: '100%',
width: '100%'
});
});
</script>
</body>
</html>
<!doctype html>
<html class="zc-html">
<head>
<meta charset="utf-8">
<title>ZingSoft Demo</title>
<script src="https://cdn.zingchart.com/zingchart.min.js"></script>
</head>
<body class="zc-body">
<div id="myChart" class="chart--container">
<a href="https://www.zingchart.com/" rel="noopener" class="zc-ref">Powered by ZingChart</a>
</div>
</body>
</html>
// CHART CONFIG
// -----------------------------
let myConfig = {
  shapes: [
    {
      type: 'zingchart.maps',
      options: {
        name: 'usa',
        scrolling: false,
        style: {
          label: {
            visible: false
          },
          items: {
            CA: {
              backgroundColor: '#9e9e9e'
            }
          }
        }
      }
    },
    {
      type: 'circle', // shapeid is OPTIONAL but smart if you are targeting events to this shape
      id: 'sd',
      map: 'usa', // assigning to map name or id is necessary
      backgroundColor: '#4dd0e1',
      cursor: 'pointer',
      size: 15,
      target: '_blank', // just like HTMl we have
      url: 'https://en.wikipedia.org/wiki/Anchorman:_The_Legend_of_Ron_Burgundy', // is how you link url to shapestarget _blank
      x: '-117.1611lon', // hook shape based on lon/lat
      y: '32.7157lat',   // hook shape based on lon/lat
      tooltip: {
        text: 'We\'re located right in San Diego!',
        backgroundColor: '#ff9800',
        borderColor: '#333',
        borderRadius: 4,
        fontSize: 16
      }
    }
  ]
};

// EVENTS
// -----------------------------
zingchart.bind(null, 'shape_click', function (e) {
  if (e.shapeid === 'sd')
    console.log(e)
});

// RENDER CHARTS
// -----------------------------
zingchart.loadModules('maps, maps-usa', function () {
  zingchart.render({
    id: 'myChart',
    data: myConfig,
    height: '100%',
    width: '100%'
  });
});