<!doctype html>
<html class="zc-html">
<head>
<meta charset="utf-8">
<title>ZingSoft Demo</title>
<script nonce="undefined" src="https://cdn.zingchart.com/zingchart.min.js"></script>
<style>
.chart--container {
height: 100%;
width: 100%;
min-height: 530px;
}
.zc-ref {
display: none;
}
</style>
</head>
<body class="zc-body">
<div id="myChart" class="chart--container">
<a href="https://www.zingchart.com/" rel="noopener" class="zc-ref">Powered by ZingChart</a>
</div>
<script>
ZC.LICENSE = ["569d52cefae586f634c54f86dc99e6a9", "b55b025e438fa8a98e32482b5f768ff5"]; // CHART CONFIG
// -----------------------------
let chartConfig = {
type: 'piano',
globals: {
bold: true,
fontFamily: 'arial',
},
backgroundColor: '#fff',
title: {
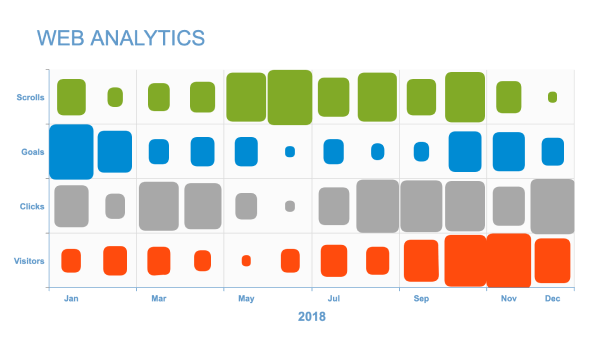
text: 'WEB ANALYTICS',
marginTop: '25px',
backgroundColor: 'none',
fontColor: '#6699CC',
fontSize: '30px',
fontWeight: 'normal',
textAlign: 'left',
x: '70px',
},
plot: {
tooltip: {
borderRadius: '10px',
shadow: false,
},
aspect: 'size',
borderRadius: '10px',
},
plotarea: {
margin: '20% 10% 15% 10%',
backgroundColor: '#FBFBFB',
},
scaleX: {
values: [
'Jan',
'Feb',
'Mar',
'Apr',
'May',
'Jun',
'Jul',
'Aug',
'Sep',
'Oct',
'Nov',
'Dec',
],
item: {
fontColor: '#6699CC',
},
label: {
text: '2018',
fontColor: '#6699CC',
fontSize: '18px',
},
lineColor: '#6699CC',
tick: {
lineColor: '#6699CC',
},
},
scaleY: {
values: ['Visitors', 'Clicks', 'Goals', 'Scrolls'],
item: {
fontColor: '#6699CC',
},
lineColor: '#6699CC',
tick: {
lineColor: '#6699CC',
},
},
series: [{
text: 'Visitors',
values: [
25707, 26524, 26372, 25273, 23980, 25652, 26943, 26367, 28325, 29657,
30101, 28541,
],
backgroundColor: '#ff4e00',
thousandsSeparator: ',',
},
{
text: 'Clicks',
values: [
6944, 6747, 7020, 6987, 6772, 6600, 6897, 7062, 7049, 7034, 6912, 7090,
],
backgroundColor: '#a8a8a8',
thousandsSeparator: ',',
},
{
text: 'Goals',
values: [445, 423, 392, 399, 399, 369, 393, 377, 383, 420, 418, 397],
backgroundColor: '#1a87d5',
thousandsSeparator: ',',
},
{
text: 'Scrolls',
values: [
1600, 1523, 1561, 1578, 1661, 1688, 1613, 1658, 1600, 1665, 1580, 1488,
],
backgroundColor: '#7eac10',
thousandsSeparator: ',',
},
],
};
// RENDER CHARTS
// -----------------------------
zingchart.render({
id: 'myChart',
data: chartConfig,
});
</script>
</body>
</html>
// CHART CONFIG
// -----------------------------
let chartConfig = {
  type: 'piano',
  globals: {
    bold: true,
    fontFamily: 'arial',
  },
  backgroundColor: '#fff',
  title: {
    text: 'WEB ANALYTICS',
    marginTop: '25px',
    backgroundColor: 'none',
    fontColor: '#6699CC',
    fontSize: '30px',
    fontWeight: 'normal',
    textAlign: 'left',
    x: '70px',
  },
  plot: {
    tooltip: {
      borderRadius: '10px',
      shadow: false,
    },
    aspect: 'size',
    borderRadius: '10px',
  },
  plotarea: {
    margin: '20% 10% 15% 10%',
    backgroundColor: '#FBFBFB',
  },
  scaleX: {
    values: [
      'Jan',
      'Feb',
      'Mar',
      'Apr',
      'May',
      'Jun',
      'Jul',
      'Aug',
      'Sep',
      'Oct',
      'Nov',
      'Dec',
    ],
    item: {
      fontColor: '#6699CC',
    },
    label: {
      text: '2018',
      fontColor: '#6699CC',
      fontSize: '18px',
    },
    lineColor: '#6699CC',
    tick: {
      lineColor: '#6699CC',
    },
  },
  scaleY: {
    values: ['Visitors', 'Clicks', 'Goals', 'Scrolls'],
    item: {
      fontColor: '#6699CC',
    },
    lineColor: '#6699CC',
    tick: {
      lineColor: '#6699CC',
    },
  },
  series: [
    {
      text: 'Visitors',
      values: [
        25707, 26524, 26372, 25273, 23980, 25652, 26943, 26367, 28325, 29657,
        30101, 28541,
      ],
      backgroundColor: '#ff4e00',
      thousandsSeparator: ',',
    },
    {
      text: 'Clicks',
      values: [
        6944, 6747, 7020, 6987, 6772, 6600, 6897, 7062, 7049, 7034, 6912, 7090,
      ],
      backgroundColor: '#a8a8a8',
      thousandsSeparator: ',',
    },
    {
      text: 'Goals',
      values: [445, 423, 392, 399, 399, 369, 393, 377, 383, 420, 418, 397],
      backgroundColor: '#1a87d5',
      thousandsSeparator: ',',
    },
    {
      text: 'Scrolls',
      values: [
        1600, 1523, 1561, 1578, 1661, 1688, 1613, 1658, 1600, 1665, 1580, 1488,
      ],
      backgroundColor: '#7eac10',
      thousandsSeparator: ',',
    },
  ],
};

// RENDER CHARTS
// -----------------------------
zingchart.render({
  id: 'myChart',
  data: chartConfig,
});