<!DOCTYPE html>
<html>
<head>
<meta charset="utf-8">
<title>ZingSoft Demo</title>
<script nonce="undefined" src="https://cdn.zingchart.com/zingchart.min.js"></script>
<script nonce="undefined">
zingchart.MODULESDIR = "https://cdn.zingchart.com/modules/";
ZC.LICENSE = ["bab21d016b2dadc18447d2a055f061e3"];
</script>
<style>
.zc-body {
margin: 10px;
padding: 10px;
background-color: #fff;
}
input,
button,
select,
textarea,
label {
font-family: 'Lucida Sans Unicode', Monaco, Tahoma, Verdana, Arial;
}
.zc-watermark {
display: none;
}
;
</style>
</head>
<body class="zc-body">
<div>
<div id="zch"></div>
<div id="zcg" style="float:left"></div>
<div id="zcv" style="float:left"></div>
</div>
<script>
ZC.LICENSE = ["569d52cefae586f634c54f86dc99e6a9", "b55b025e438fa8a98e32482b5f768ff5"];
let iCols = 100;
let iRows = 50;
let iSize = 5;
let chartConfig = {
type: 'null',
backgroundColor: '#fff',
heatmap: {
alpha: 1,
blur: iSize,
brushType: 'square',
maxValue: 1,
minValue: 0,
size: iSize,
},
};
function createArr(iCols, iRows) {
let aData = new Array(iCols);
for (let i = 0; i < aData.length; i++) {
aData[i] = new Array(iRows);
}
return aData;
}
let aGrid = createArr(iCols, iRows);
let aHValues = [],
aVValues = [];
for (let i = 0; i < iCols; i++) {
aHValues[i] = 0;
for (let j = 0; j < iRows; j++) {
aGrid[i][j] = Math.floor(2 * Math.random());
if (aVValues[j] === null || typeof aVValues[j] === 'undefined') {
aVValues[j] = 0;
}
aHValues[i] += aGrid[i][j];
aVValues[j] += aGrid[i][j];
}
}
zingchart.bind('zcg', 'load', function() {
step();
});
function step() {
let i, j;
let aNextGrid = createArr(iCols, iRows);
aHValues = [];
aVValues = [];
for (i = 0; i < iCols; i++) {
aHValues[i] = 0;
for (j = 0; j < iRows; j++) {
let iState = aGrid[i][j];
let iSum = 0;
let iNeighbors = countNeighbors(aGrid, i, j);
if (iState === 0 && iNeighbors === 3) {
aNextGrid[i][j] = 1;
} else if (iState === 1 && (iNeighbors < 2 || iNeighbors > 3)) {
aNextGrid[i][j] = 0;
} else {
aNextGrid[i][j] = iState;
}
aHValues[i] += aNextGrid[i][j];
if (aVValues[j] === null || typeof aVValues[j] === 'undefined') {
aVValues[j] = 0;
}
aVValues[j] += aNextGrid[i][j];
}
}
aGrid = aNextGrid;
let aData = [];
for (i = 0; i < iCols; i++) {
for (j = 0; j < iRows; j++) {
aData.push([i * iSize, j * iSize, aGrid[i][j]]);
}
}
zingchart.exec('zcg', 'heatmap.setdata', {
data: aData,
});
zingchart.exec('zch', 'setseriesvalues', {
plotindex: 0,
values: aHValues,
});
zingchart.exec('zcv', 'setseriesvalues', {
plotindex: 0,
values: aVValues,
});
window.setTimeout(step, 15);
}
function countNeighbors(aGrid, iX, iY) {
let iSum = 0;
for (let i = -1; i < 2; i++) {
for (let j = -1; j < 2; j++) {
let iCol = (iX + i + iCols) % iCols;
let iRow = (iY + j + iRows) % iRows;
iSum += aGrid[iCol][iRow];
}
}
iSum -= aGrid[iX][iY];
return iSum;
}
zingchart.loadModules('heatmap', function() {
zingchart.render({
id: 'zcg',
width: iCols * iSize,
height: iRows * iSize,
output: 'canvas',
data: chartConfig,
modules: 'heatmap',
});
zingchart.render({
id: 'zch',
width: iCols * iSize,
height: '80px',
output: 'canvas',
data: {
type: 'area',
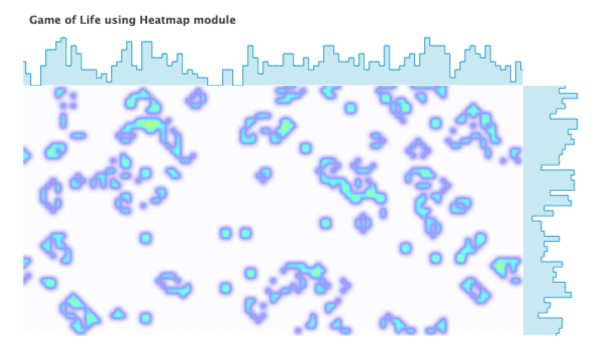
title: {
text: 'Game of Life using Heatmap module',
fontSize: '11px',
align: 'left',
},
plot: {
shadow: false,
aspect: 'stepped',
lineWidth: '1px',
maxNodes: 0,
maxTrackers: 0,
},
plotarea: {
margin: '20 0 0 0',
},
scaleX: {
visible: false,
},
scaleY: {
visible: false,
},
series: [{
values: aHValues,
}, ],
},
});
zingchart.render({
id: 'zcv',
width: '80px',
height: iRows * iSize,
output: 'canvas',
data: {
type: 'varea',
plot: {
shadow: false,
aspect: 'stepped',
maxNodes: 0,
maxTrackers: 0,
lineWidth: '1px',
},
plotarea: {
margin: '0 20 0 0',
},
scaleX: {
mirrored: true,
visible: false,
},
scaleY: {
visible: false,
},
series: [{
values: aHValues,
}, ],
},
});
});
</script>
</body>
</html>
let iCols = 100;
let iRows = 50;
let iSize = 5;

let chartConfig = {
  type: 'null',
  backgroundColor: '#fff',
  heatmap: {
    alpha: 1,
    blur: iSize,
    brushType: 'square',
    maxValue: 1,
    minValue: 0,
    size: iSize,
  },
};

function createArr(iCols, iRows) {
  let aData = new Array(iCols);
  for (let i = 0; i < aData.length; i++) {
    aData[i] = new Array(iRows);
  }
  return aData;
}

let aGrid = createArr(iCols, iRows);
let aHValues = [],
  aVValues = [];
for (let i = 0; i < iCols; i++) {
  aHValues[i] = 0;
  for (let j = 0; j < iRows; j++) {
    aGrid[i][j] = Math.floor(2 * Math.random());
    if (aVValues[j] === null || typeof aVValues[j] === 'undefined') {
      aVValues[j] = 0;
    }
    aHValues[i] += aGrid[i][j];
    aVValues[j] += aGrid[i][j];
  }
}

zingchart.bind('zcg', 'load', function () {
  step();
});

function step() {
  let i, j;
  let aNextGrid = createArr(iCols, iRows);
  aHValues = [];
  aVValues = [];

  for (i = 0; i < iCols; i++) {
    aHValues[i] = 0;
    for (j = 0; j < iRows; j++) {
      let iState = aGrid[i][j];
      let iSum = 0;
      let iNeighbors = countNeighbors(aGrid, i, j);

      if (iState === 0 && iNeighbors === 3) {
        aNextGrid[i][j] = 1;
      } else if (iState === 1 && (iNeighbors < 2 || iNeighbors > 3)) {
        aNextGrid[i][j] = 0;
      } else {
        aNextGrid[i][j] = iState;
      }

      aHValues[i] += aNextGrid[i][j];
      if (aVValues[j] === null || typeof aVValues[j] === 'undefined') {
        aVValues[j] = 0;
      }
      aVValues[j] += aNextGrid[i][j];
    }
  }

  aGrid = aNextGrid;

  let aData = [];
  for (i = 0; i < iCols; i++) {
    for (j = 0; j < iRows; j++) {
      aData.push([i * iSize, j * iSize, aGrid[i][j]]);
    }
  }
  zingchart.exec('zcg', 'heatmap.setdata', {
    data: aData,
  });

  zingchart.exec('zch', 'setseriesvalues', {
    plotindex: 0,
    values: aHValues,
  });
  zingchart.exec('zcv', 'setseriesvalues', {
    plotindex: 0,
    values: aVValues,
  });

  window.setTimeout(step, 15);
}

function countNeighbors(aGrid, iX, iY) {
  let iSum = 0;
  for (let i = -1; i < 2; i++) {
    for (let j = -1; j < 2; j++) {
      let iCol = (iX + i + iCols) % iCols;
      let iRow = (iY + j + iRows) % iRows;
      iSum += aGrid[iCol][iRow];
    }
  }
  iSum -= aGrid[iX][iY];
  return iSum;
}

zingchart.loadModules('heatmap', function () {
  zingchart.render({
    id: 'zcg',
    width: iCols * iSize,
    height: iRows * iSize,
    output: 'canvas',
    data: chartConfig,
    modules: 'heatmap',
  });

  zingchart.render({
    id: 'zch',
    width: iCols * iSize,
    height: '80px',
    output: 'canvas',
    data: {
      type: 'area',
      title: {
        text: 'Game of Life using Heatmap module',
        fontSize: '11px',
        align: 'left',
      },
       plot: {
        shadow: false,
        aspect: 'stepped',
        lineWidth: '1px',
        maxNodes: 0,
        maxTrackers: 0,
      },
      plotarea: {
        margin: '20 0 0 0',
      },
      scaleX: {
        visible: false,
      },
      scaleY: {
        visible: false,
      },
      series: [
        {
          values: aHValues,
        },
      ],
    },
  });

  zingchart.render({
    id: 'zcv',
    width: '80px',
    height: iRows * iSize,
    output: 'canvas',
    data: {
      type: 'varea',
      plot: {
        shadow: false,
        aspect: 'stepped',
        maxNodes: 0,
        maxTrackers: 0,
        lineWidth: '1px',
      },
      plotarea: {
        margin: '0 20 0 0',
      },
      scaleX: {
        mirrored: true,
        visible: false,
      },
      scaleY: {
        visible: false,
      },
      series: [
        {
          values: aHValues,
        },
      ],
    },
  });
});