<!DOCTYPE html>
<html>
<head>
<meta charset="utf-8">
<title>ZingSoft Demo</title>
<script nonce="undefined" src="https://cdn.zingchart.com/zingchart.min.js"></script>
<script nonce="undefined">
zingchart.MODULESDIR = "https://cdn.zingchart.com/modules/";
</script>
<style>
.zc-body {
margin: 10px;
padding: 10px;
font-family: 'Lucida Sans Unicode', Monaco, Tahoma, Verdana, Arial;
}
.zc-body input,
.zc-body button,
.zc-body select,
.zc-body textarea,
.zc-body label {
font-family: 'Lucida Sans Unicode', Monaco, Tahoma, Verdana, Arial;
}
.countries {
height: 400px;
width: 150px;
overflow: auto;
margin-left: 820px;
margin-top: -550px;
font-size: 12px;
border: 1px solid #ddd;
}
.countries label {
font-weight: 600;
width: 90%;
display: block;
padding: 4px 6px;
}
.countries input[type=checkbox] {
width: 17px;
height: 17px;
margin: 0 4px 0 0;
vertical-align: bottom;
}
</style>
</head>
<body class="zc-body">
<script nonce="undefined" src="https://code.jquery.com/jquery-2.2.4.min.js" integrity="sha256-BbhdlvQf/xTY9gja0Dq3HiwQF8LaCRTXxZKRutelT44=" crossorigin="anonymous">
</script>
<div id="zc"></div>
<div id="chkCountries" class="countries"></div>
<script>
ZC.LICENSE = ["569d52cefae586f634c54f86dc99e6a9", "b55b025e438fa8a98e32482b5f768ff5"]; // Pointing to Zingchart's CDN module location. Without this, it will try to find ZC modules on Codepen's CDN
zingchart.MODULESDIR = 'https://cdn.zingchart.com/modules/';
let aCountries = [
'Argentina',
'Australia',
'Austria',
'Belgium',
'Bolivia',
'Brazil',
'Canada',
'Chile',
'China',
'Croatia',
'Denmark',
'Egypt',
'Finland',
'France',
'Germany',
'Greece',
'Iceland',
'India',
'Indonesia',
'Italy',
'Japan',
'Luxembourg',
'Mexico',
'Netherlands',
'Norway',
'Peru',
'Portugal',
'Romania',
'Spain',
'Switzerland',
'Thailand',
'United Kingdom',
'United States',
'Venezuela',
];
let iLineX = 70;
let iLineY = 80;
let chkList = $('#chkCountries');
$.each(aCountries, function(i) {
let id = aCountries[i].replace(/[^a-zA-Z]/gi, '').toLowerCase();
let oLabel = $('<label/>')
.attr('id', 'lbl' + id)
.attr('for', id)
.appendTo(chkList);
let oInput = $('<input/>')
.attr('type', 'checkbox')
.attr('id', id)
.attr('class', 'chkCountry')
.attr('checked', false)
.appendTo(oLabel);
oLabel.append(aCountries[i]);
});
$('.chkCountry').click(function() {
zingchart.exec('zc', 'update', {
graphid: 0,
});
});
let _r_ = function(min, max) {
return Math.round(min + (max - min) * Math.random());
};
let nrVal = aCountries.length;
let aData = [];
let aDataTxt = [];
for (let i = 0; i < nrVal; i++) {
let r1 = _r_(iLineX - 30, iLineX + 30);
let r2 = _r_(iLineY - 20, iLineY + 20);
aData.push([r1, r2]);
aDataTxt.push(aCountries[i].replace(/[^a-zA-Z]/gi, '').toLowerCase());
}
let chartConfig = {
type: 'scatter',
backgroundColor: '#FFF',
title: {
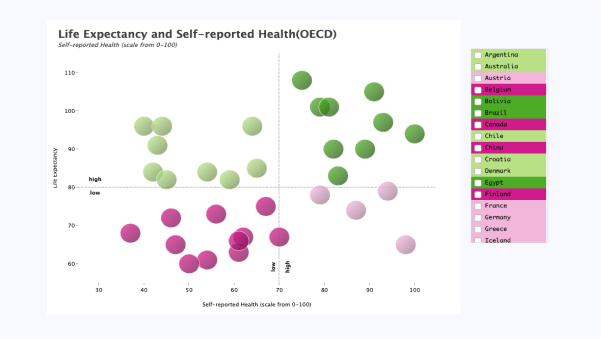
text: 'Life Expectancy and Self-Reported Health (OECD)',
align: 'left',
fontSize: '22px',
paddingLeft: '10px',
},
subtitle: {
text: 'Self-reported Health (scale from 0-100)',
align: 'left',
fontSize: '12px',
fontStyle: 'italic',
fontWeight: 'normal',
padding: '5 0 10 10',
},
scaleX: {
guide: {
visible: false,
},
item: {
color: '#000',
fontSize: '11px',
fontWeight: 'normal',
},
label: {
text: 'Self-reported Health (scale from 0-100)',
fontColor: '#000',
fontWeight: 'normal',
fontSize: '11px',
paddingTop: '15px',
},
lineWidth: '0px',
markers: [{
type: 'line',
lineStyle: 'dotted',
lineColor: '#000',
text: 'low<br><br>high',
valueRange: true,
label: {
offsetX: '-40px',
paddingBottom: '40px',
fontWeight: 'bold',
},
range: [iLineX],
}, ],
offset: '40px',
step: 10,
tick: {
visible: true,
},
},
plot: {
tooltip: {
text: '<span style="font-size:17px;font-weight:bold;">%data-countries</span><br><br>Life expectancy: <b>%node-value</b> years<br>Self-reported health: <b>%scale-key-value</b>',
align: 'left',
fontSize: '12px',
padding: '10px',
},
animation: {
effect: 'ANIMATION_FADE_IN',
method: 0,
sequence: 0,
speed: 400,
},
dataCountries: aCountries,
dataTxt: aDataTxt,
},
scaleY: {
guide: {
visible: false,
},
item: {
color: '#000',
fontSize: '11px',
fontWeight: 'normal',
},
label: {
text: 'Life Expectancy',
fontColor: '#000',
fontWeight: 'normal',
fontSize: '11px',
paddingRight: '15px',
},
markers: [{
type: 'line',
lineStyle: 'dotted',
lineColor: '#000',
text: 'high<br><br>low',
label: {
offsetY: '20px',
paddingLeft: '20px',
fontWeight: 'bold',
},
range: [iLineY],
}, ],
minValue: 'auto',
lineWidth: '0px',
offset: '40px',
tick: {
visible: true,
},
},
series: [{
valueBox: {
text: '%data-countries',
color: '#000',
fontSize: '11px',
fontWeight: 'bold',
jsRule: 'plot_rule(2)',
offsetY: '45px',
},
values: aData,
hoverMarker: {
visible: false,
},
marker: {
borderColor: '#FFF',
borderWidth: '1px',
fillAngle: 45,
fillType: 'linear',
jsRule: 'plot_rule(0)',
shadowDistance: '3px',
size: 20,
},
tooltip: {
jsRule: 'plot_rule(1)',
},
}, ],
};
window.plot_rule = function(p, t) {
let obj = {},
color = '',
fontColor = '#FFF';
let iChecked = $('.chkCountry:checked').length;
if (t === '0' || t === '1') {
if (p.value <= iLineY && p.key <= iLineX) {
color = '#D01C8B #821257';
} else if (p.value > iLineY && p.key <= iLineX) {
color = '#B8E186 #799358';
fontColor = '#000';
} else if (p.value <= iLineY && p.key > iLineX) {
color = '#F1B6DA #A37C94';
fontColor = '#000';
} else if (p.value > iLineY && p.key > iLineX) {
color = '#4DAC26 #2B5E15';
}
$('#lbl' + p['data-txt']).css('background-color', color.split(' ')[0]);
obj['background-color'] = color;
obj['font-color'] = fontColor;
if (t === '0') {
obj['shadow'] = $('#' + p['data-txt']).prop('checked');
obj['border-color'] = $('#' + p['data-txt']).prop('checked') ?
'#666' :
'#FFF';
obj['size'] = $('#' + p['data-txt']).prop('checked') ? 22 : 20;
obj['alpha'] = $('#' + p['data-txt']).prop('checked') ?
1 :
iChecked === 0 ?
0.75 :
0.05;
}
} else {
obj['visible'] = $('#' + p['data-txt']).prop('checked');
}
return obj;
};
let update = function() {
for (let i = 0; i < nrVal; i++) {
aData[i][0] += _r_(-2, 2);
aData[i][1] += _r_(-2, 2);
}
zingchart.exec('zc', 'setseriesvalues', {
plotindex: 0,
values: aData,
});
};
zingchart.render({
id: 'zc',
width: '800px',
height: '600px',
output: 'svg',
data: chartConfig,
events: {
load: function() {
setInterval(function() {
update();
}, 2500);
},
},
});
</script>
</body>
</html>
// Pointing to Zingchart's CDN module location. Without this, it will try to find ZC modules on Codepen's CDN
zingchart.MODULESDIR = 'https://cdn.zingchart.com/modules/';
let aCountries = [
  'Argentina',
  'Australia',
  'Austria',
  'Belgium',
  'Bolivia',
  'Brazil',
  'Canada',
  'Chile',
  'China',
  'Croatia',
  'Denmark',
  'Egypt',
  'Finland',
  'France',
  'Germany',
  'Greece',
  'Iceland',
  'India',
  'Indonesia',
  'Italy',
  'Japan',
  'Luxembourg',
  'Mexico',
  'Netherlands',
  'Norway',
  'Peru',
  'Portugal',
  'Romania',
  'Spain',
  'Switzerland',
  'Thailand',
  'United Kingdom',
  'United States',
  'Venezuela',
];
let iLineX = 70;
let iLineY = 80;

let chkList = $('#chkCountries');

$.each(aCountries, function (i) {
  let id = aCountries[i].replace(/[^a-zA-Z]/gi, '').toLowerCase();

  let oLabel = $('<label/>')
    .attr('id', 'lbl' + id)
    .attr('for', id)
    .appendTo(chkList);

  let oInput = $('<input/>')
    .attr('type', 'checkbox')
    .attr('id', id)
    .attr('class', 'chkCountry')
    .attr('checked', false)
    .appendTo(oLabel);

  oLabel.append(aCountries[i]);
});

$('.chkCountry').click(function () {
  zingchart.exec('zc', 'update', {
    graphid: 0,
  });
});

let _r_ = function (min, max) {
  return Math.round(min + (max - min) * Math.random());
};

let nrVal = aCountries.length;
let aData = [];
let aDataTxt = [];

for (let i = 0; i < nrVal; i++) {
  let r1 = _r_(iLineX - 30, iLineX + 30);
  let r2 = _r_(iLineY - 20, iLineY + 20);
  aData.push([r1, r2]);

  aDataTxt.push(aCountries[i].replace(/[^a-zA-Z]/gi, '').toLowerCase());
}

let chartConfig = {
  type: 'scatter',
  backgroundColor: '#FFF',
  title: {
    text: 'Life Expectancy and Self-Reported Health (OECD)',
    align: 'left',
    fontSize: '22px',
    paddingLeft: '10px',
  },
  subtitle: {
    text: 'Self-reported Health (scale from 0-100)',
    align: 'left',
    fontSize: '12px',
    fontStyle: 'italic',
    fontWeight: 'normal',
    padding: '5 0 10 10',
  },
  scaleX: {
    guide: {
      visible: false,
    },
    item: {
      color: '#000',
      fontSize: '11px',
      fontWeight: 'normal',
    },
    label: {
      text: 'Self-reported Health (scale from 0-100)',
      fontColor: '#000',
      fontWeight: 'normal',
      fontSize: '11px',
      paddingTop: '15px',
    },
    lineWidth: '0px',
    markers: [
      {
        type: 'line',
        lineStyle: 'dotted',
        lineColor: '#000',
        text: 'low<br><br>high',
        valueRange: true,
        label: {
          offsetX: '-40px',
          paddingBottom: '40px',
          fontWeight: 'bold',
        },
        range: [iLineX],
      },
    ],
    offset: '40px',
    step: 10,
    tick: {
      visible: true,
    },
  },
  plot: {
    tooltip: {
      text: '<span style="font-size:17px;font-weight:bold;">%data-countries</span><br><br>Life expectancy: <b>%node-value</b> years<br>Self-reported health: <b>%scale-key-value</b>',
      align: 'left',
      fontSize: '12px',
      padding: '10px',
    },
    animation: {
      effect: 'ANIMATION_FADE_IN',
      method: 0,
      sequence: 0,
      speed: 400,
    },
    dataCountries: aCountries,
    dataTxt: aDataTxt,
  },
  scaleY: {
    guide: {
      visible: false,
    },
    item: {
      color: '#000',
      fontSize: '11px',
      fontWeight: 'normal',
    },
    label: {
      text: 'Life Expectancy',
      fontColor: '#000',
      fontWeight: 'normal',
      fontSize: '11px',
      paddingRight: '15px',
    },
    markers: [
      {
        type: 'line',
        lineStyle: 'dotted',
        lineColor: '#000',
        text: 'high<br><br>low',
        label: {
          offsetY: '20px',
          paddingLeft: '20px',
          fontWeight: 'bold',
        },
        range: [iLineY],
      },
    ],
    minValue: 'auto',
    lineWidth: '0px',
    offset: '40px',
    tick: {
      visible: true,
    },
  },
  series: [
    {
      valueBox: {
        text: '%data-countries',
        color: '#000',
        fontSize: '11px',
        fontWeight: 'bold',
        jsRule: 'plot_rule(2)',
        offsetY: '45px',
      },
      values: aData,
      hoverMarker: {
        visible: false,
      },
      marker: {
        borderColor: '#FFF',
        borderWidth: '1px',
        fillAngle: 45,
        fillType: 'linear',
        jsRule: 'plot_rule(0)',
        shadowDistance: '3px',
        size: 20,
      },
      tooltip: {
        jsRule: 'plot_rule(1)',
      },
    },
  ],
};

window.plot_rule = function (p, t) {
  let obj = {},
    color = '',
    fontColor = '#FFF';

  let iChecked = $('.chkCountry:checked').length;

  if (t === '0' || t === '1') {
    if (p.value <= iLineY && p.key <= iLineX) {
      color = '#D01C8B #821257';
    } else if (p.value > iLineY && p.key <= iLineX) {
      color = '#B8E186 #799358';
      fontColor = '#000';
    } else if (p.value <= iLineY && p.key > iLineX) {
      color = '#F1B6DA #A37C94';
      fontColor = '#000';
    } else if (p.value > iLineY && p.key > iLineX) {
      color = '#4DAC26 #2B5E15';
    }

    $('#lbl' + p['data-txt']).css('background-color', color.split(' ')[0]);

    obj['background-color'] = color;
    obj['font-color'] = fontColor;

    if (t === '0') {
      obj['shadow'] = $('#' + p['data-txt']).prop('checked');
      obj['border-color'] = $('#' + p['data-txt']).prop('checked')
        ? '#666'
        : '#FFF';
      obj['size'] = $('#' + p['data-txt']).prop('checked') ? 22 : 20;
      obj['alpha'] = $('#' + p['data-txt']).prop('checked')
        ? 1
        : iChecked === 0
        ? 0.75
        : 0.05;
    }
  } else {
    obj['visible'] = $('#' + p['data-txt']).prop('checked');
  }
  return obj;
};

let update = function () {
  for (let i = 0; i < nrVal; i++) {
    aData[i][0] += _r_(-2, 2);
    aData[i][1] += _r_(-2, 2);
  }

  zingchart.exec('zc', 'setseriesvalues', {
    plotindex: 0,
    values: aData,
  });
};

zingchart.render({
  id: 'zc',
  width: '800px',
  height: '600px',
  output: 'svg',
  data: chartConfig,
  events: {
    load: function () {
      setInterval(function () {
        update();
      }, 2500);
    },
  },
});