<!doctype html>
<html class="zc-html">
<head>
<meta charset="utf-8">
<title>ZingSoft Demo</title>
<script nonce="undefined" src="https://cdn.zingchart.com/zingchart.min.js"></script>
<style>
.zc-body {
background: #fff;
}
.chart--container {
height: 100%;
width: 100%;
min-height: 600px;
}
.zc-ref {
display: none;
}
</style>
</head>
<body class="zc-body">
<div id="myChart" class="chart--container">
<a href="https://www.zingchart.com/" rel="noopener" class="zc-ref">Powered by ZingChart</a>
</div>
<script>
ZC.LICENSE = ["569d52cefae586f634c54f86dc99e6a9", "b55b025e438fa8a98e32482b5f768ff5"];
let chartConfig = {
type: 'treemap',
title: {
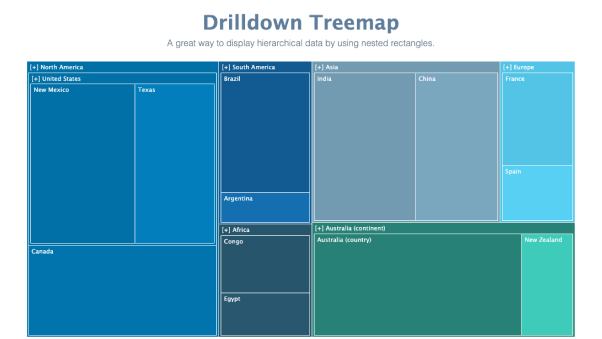
text: 'Drilldown Treemap',
adjustLayout: true,
align: 'center',
color: '#5D7D9A',
fontSize: '36px'
},
subtitle: {
text: 'A great way to display hierarchical data by using nested rectangles.',
fontColor: '#687c8c',
fontFamily: 'sans-serif',
fontSize: '16px',
fontWeight: '300',
offsetY: '20px',
textAlign: 'center'
},
options: {
colorType: 'palette',
palette: ['#02a3f4', '#5bd6fa', '#295a72', '#99d1ee', '#156eb0', '#43d7c5'],
splitType: 'balanced'
},
plotarea: {
margin: '100px 0 0 0'
},
series: [{
text: 'North America',
children: [{
text: 'United States',
children: [{
text: 'Texas',
value: 10
},
{
text: 'New Mexico',
value: 13
}
]
},
{
text: 'Canada',
value: 12
}
]
},
{
text: 'Europe',
children: [{
text: 'France',
value: 5
},
{
text: 'Spain',
value: 3
}
]
},
{
text: 'Africa',
children: [{
text: 'Egypt',
value: 3
},
{
text: 'Congo',
value: 4
}
]
},
{
text: 'Asia',
children: [{
text: 'India',
value: 11
},
{
text: 'China',
value: 9
}
]
},
{
text: 'South America',
children: [{
text: 'Brazil',
value: 8
},
{
text: 'Argentina',
value: 2
}
]
},
{
text: 'Australia (continent)',
children: [{
text: 'Australia (country)',
value: 16
},
{
text: 'New Zealand',
value: 4
}
]
}
]
};
zingchart.render({
id: 'myChart',
data: chartConfig,
height: '100%',
width: '100%'
});
</script>
</body>
</html>
let chartConfig = {
  type: 'treemap',
  title: {
    text: 'Drilldown Treemap',
    adjustLayout: true,
    align: 'center',
    color: '#5D7D9A',
    fontSize: '36px'
  },
  subtitle: {
    text: 'A great way to display hierarchical data by using nested rectangles.',
    fontColor: '#687c8c',
    fontFamily: 'sans-serif',
    fontSize: '16px',
    fontWeight: '300',
    offsetY: '20px',
    textAlign: 'center'
  },
  options: {
    colorType: 'palette',
    palette: ['#02a3f4', '#5bd6fa', '#295a72', '#99d1ee', '#156eb0', '#43d7c5'],
    splitType: 'balanced'
  },
  plotarea: {
    margin: '100px 0 0 0'
  },
  series: [
    {
      text: 'North America',
      children: [
        {
          text: 'United States',
          children: [
            {
              text: 'Texas',
              value: 10
            },
            {
              text: 'New Mexico',
              value: 13
            }
          ]
        },
        {
          text: 'Canada',
          value: 12
        }
      ]
    },
    {
      text: 'Europe',
      children: [
        {
          text: 'France',
          value: 5
        },
        {
          text: 'Spain',
          value: 3
        }
      ]
    },
    {
      text: 'Africa',
      children: [
        {
          text: 'Egypt',
          value: 3
        },
        {
          text: 'Congo',
          value: 4
        }
      ]
    },
    {
      text: 'Asia',
      children: [
        {
          text: 'India',
          value: 11
        },
        {
          text: 'China',
          value: 9
        }
      ]
    },
    {
      text: 'South America',
      children: [
        {
          text: 'Brazil',
          value: 8
        },
        {
          text: 'Argentina',
          value: 2
        }
      ]
    },
    {
      text: 'Australia (continent)',
      children: [
        {
          text: 'Australia (country)',
          value: 16
        },
        {
          text: 'New Zealand',
          value: 4
        }
      ]
    }
  ]
};

zingchart.render({
  id: 'myChart',
  data: chartConfig,
  height: '100%',
  width: '100%'
});