<!DOCTYPE html>
<html>
<head>
<meta charset="utf-8">
<title>ZingSoft Demo</title>
<script nonce="undefined" src="https://cdn.zingchart.com/zingchart.min.js"></script>
<style>
.chart--container {
width: 100%;
height: 100%;
min-height: 530px;
}
.zc-ref {
display: none;
}
</style>
</head>
<body>
<div id="myChart" class="chart--container">
<a class="zc-ref" href="https://www.zingchart.com/">Powered by ZingChart</a>
</div>
<script>
ZC.LICENSE = ["569d52cefae586f634c54f86dc99e6a9", "b55b025e438fa8a98e32482b5f768ff5"];
let _hsl2rgb_ = (iH, iS, iL) => {
let iR, iG, iB;
if (iS == 0) {
iR = iG = iB = iL;
} else {
let hue2rgb = (p, q, t) => {
if (t < 0) t += 1;
if (t > 1) t -= 1;
if (t < 1 / 6) return p + (q - p) * 6 * t;
if (t < 1 / 2) return q;
if (t < 2 / 3) return p + (q - p) * (2 / 3 - t) * 6;
return p;
};
let q = iL < 0.5 ? iL * (1 + iS) : iL + iS - iL * iS;
let p = 2 * iL - q;
iR = hue2rgb(p, q, iH + 1 / 3);
iG = hue2rgb(p, q, iH);
iB = hue2rgb(p, q, iH - 1 / 3);
}
return [ZC._i_(iR * 255), ZC._i_(iG * 255), ZC._i_(iB * 255)];
};
let componentToHex = (c) => {
let hex = c.toString(16);
return hex.length == 1 ? '0' + hex : hex;
};
let rgbToHex = (r, g, b) => {
return '#' + componentToHex(r) + componentToHex(g) + componentToHex(b);
};
let _luminance_ = (sHexColor, sLight, sDark) => {
let r = parseInt(sHexColor.substr(1, 2), 16);
let g = parseInt(sHexColor.substr(3, 2), 16);
let b = parseInt(sHexColor.substr(5, 2), 16);
let yiq = (r * 299 + g * 587 + b * 114) / 1000;
return yiq >= 128 ? sDark : sLight;
};
window.myfunc = (p) => {
let h = (p.value - 100) / 200,
s = 0.75,
l = 0.5;
if (h > 0.5) {
l = 1 - h;
}
let rgb = _hsl2rgb_(h, s, l);
let rgbh = _hsl2rgb_(h / 2, s, l);
return {
backgroundColor: 'rgb(' + rgb[0] + ',' + rgb[1] + ',' + rgb[2] + ')',
fontColor: _luminance_(rgbToHex(rgb[0], rgb[1], rgb[2]), '#fff', '#000'),
hoverState: {
backgroundColor: 'rgb(' + rgbh[0] + ',' + rgbh[1] + ',' + rgbh[2] + ')',
fontColor: _luminance_(rgbToHex(rgb[0], rgb[1], rgb[2]), '#fff', '#000'),
},
};
};
let chartConfig = {
type: 'bar',
theme: 'classic',
backgroundColor: '#fff',
title: {
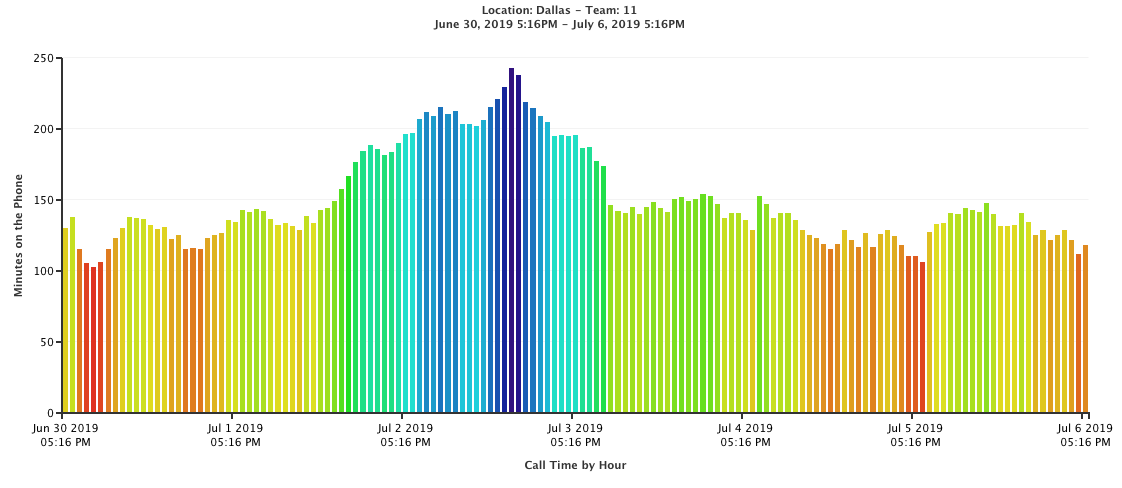
text: 'Inbound Call Report',
adjustLayout: true,
backgroundColor: '#777',
},
subtitle: {
text: 'Location: Dallas - Team: 11<br>June 30, 2019 5:16PM - July 6, 2019 5:16PM',
adjustLayout: true,
},
plot: {
tooltip: {
text: '%kl<br><br>%v<br>Minutes',
borderRadius: '5px',
decimals: 2,
fontColor: '#000',
jsRule: 'myfunc()',
shadow: false,
sticky: true,
timeout: 500,
},
jsRule: 'myfunc()',
lineWidth: '3px',
marker: {
type: 'none',
},
maxTrackers: 9999,
mode: 'normal',
shadow: false,
},
plotarea: {
adjustLayout: true,
marginRight: '35px',
},
scaleX: {
guide: {
visible: false,
},
label: {
text: 'Call Time by Hour',
fontColor: '#333',
},
lineColor: '#333',
maxItems: 7,
minValue: '1561940182000px',
step: 'hour',
tick: {
lineColor: '#333',
},
transform: {
type: 'date',
all: '%M %d %Y<br>%h:%i %A',
item: {
visible: false,
},
},
zooming: true,
},
scaleY: {
guide: {
lineColor: '#c4c4c4',
lineStyle: 'solid',
},
label: {
text: 'Minutes on the Phone',
fontColor: '#333',
},
lineColor: '#333',
step: 50,
tick: {
lineColor: '#333',
},
},
zoom: {
backgroundColor: '#20DFC6',
},
scrollX: {
bar: {
backgroundColor: '#777',
},
handle: {
backgroundColor: '#76DF20',
},
},
series: [{
values: [
130.39037190843374, 137.82352810259908, 115.42552042752504,
105.8985303575173, 103.17760393489152, 106.5157283982262,
115.92864951118827, 123.19986194372177, 130.39037190843374,
137.82352810259908, 137.13911484461278, 136.41467599198222,
132.66717618796974, 129.72170210443437, 131.15643296856433,
122.8077205363661, 125.21956569515169, 115.42552042752504,
116.27919161692262, 115.37922341842204, 123.280792334117,
125.80900968052447, 126.5779703296721, 136.0639208741486,
134.91431394591928, 143.1818949058652, 141.5956212207675,
144.00946975219995, 142.58891925681382, 136.97318396065384,
132.6707432139665, 133.59662600792944, 131.67003435548395,
128.6872488167137, 138.6640751780942, 133.68509215768427,
142.87961044348776, 144.83349648769945, 149.6387172723189,
157.63311076909304, 167.24209581501782, 176.82213213294744,
184.54013934358954, 188.76858743838966, 185.7986462675035,
181.9442157773301, 183.81773353554308, 190.00635411590338,
196.7253781761974, 197.046047761105, 207.00932875275612,
212.01005658134818, 208.9711654977873, 215.2892983937636,
210.6406500050798, 212.5627496931702, 203.31407259684056,
203.61929894890636, 201.94171560928226, 206.40297472011298,
215.6654707621783, 221.01836185436696, 230.01836185436696,
242.87961044348776, 237.87961044348776, 219.09721012692899,
214.93723195511848, 209.47212534025311, 204.76167376618832,
195.5567279458046, 195.63107108697295, 195.36074035335332,
195.68158132955432, 186.48385820444673, 187.37324917223305,
177.69300658721477, 173.9657269883901, 146.73953369259834,
142.55781156010926, 141.23191310092807, 145.27394111268222,
140.00836457125843, 145.08349590469152, 148.69954527821392,
144.63809083215892, 141.91962704528123, 150.7710352819413,
152.36544562503695, 149.3799415929243, 150.6317104632035,
154.50830295216292, 153.08651010505855, 146.96675116661936,
137.29447277262807, 140.7835721084848, 141.16032130550593,
136.29475314635783, 128.89791775960475, 153.08651010505855,
146.96675116661936, 137.29447277262807, 140.7835721084848,
141.16032130550593, 136.29475314635783, 128.89791775960475,
125.37268431857228, 123.03045104723424, 119.46262229699641,
115.46265214699641, 119.21671440359205, 128.82347344886512,
121.73517451621592, 117.21783087588847, 127.03464472200722,
117.21783087588847, 126.21696717105806, 129.02965650893748,
124.59247510880232, 118.40024844743311, 110.40024844743311,
110.40024844743311, 106.40024844743311, 127.65546347945929,
132.93117898516357, 134.1007771762088, 140.69107306189835,
140.28070971369743, 144.2097987793386, 142.87268072832376,
141.4521514531225, 147.82087058294564, 140.0491758994758,
132.14203683193773, 132.13804602622986, 132.43992226663977,
140.8460800582543, 134.65536702424288, 125.61551874503493,
129.12139180116355, 121.95768306031823, 125.61551874503493,
129.12139180116355, 121.95768306031823, 112.34819089528173,
118.24232061393559,
],
}, ],
};
zingchart.render({
id: 'myChart',
data: chartConfig,
height: '100%',
width: '100%',
});
</script>
</body>
</html>
let _hsl2rgb_ = (iH, iS, iL) => {
  let iR, iG, iB;
  if (iS == 0) {
    iR = iG = iB = iL;
  } else {
    let hue2rgb = (p, q, t) => {
      if (t < 0) t += 1;
      if (t > 1) t -= 1;
      if (t < 1 / 6) return p + (q - p) * 6 * t;
      if (t < 1 / 2) return q;
      if (t < 2 / 3) return p + (q - p) * (2 / 3 - t) * 6;
      return p;
    };
    let q = iL < 0.5 ? iL * (1 + iS) : iL + iS - iL * iS;
    let p = 2 * iL - q;
    iR = hue2rgb(p, q, iH + 1 / 3);
    iG = hue2rgb(p, q, iH);
    iB = hue2rgb(p, q, iH - 1 / 3);
  }
  return [ZC._i_(iR * 255), ZC._i_(iG * 255), ZC._i_(iB * 255)];
};

let componentToHex = (c) => {
  let hex = c.toString(16);
  return hex.length == 1 ? '0' + hex : hex;
};

let rgbToHex = (r, g, b) => {
  return '#' + componentToHex(r) + componentToHex(g) + componentToHex(b);
};

let _luminance_ = (sHexColor, sLight, sDark) => {
  let r = parseInt(sHexColor.substr(1, 2), 16);
  let g = parseInt(sHexColor.substr(3, 2), 16);
  let b = parseInt(sHexColor.substr(5, 2), 16);
  let yiq = (r * 299 + g * 587 + b * 114) / 1000;
  return yiq >= 128 ? sDark : sLight;
};

window.myfunc = (p) => {
  let h = (p.value - 100) / 200,
    s = 0.75,
    l = 0.5;
  if (h > 0.5) {
    l = 1 - h;
  }
  let rgb = _hsl2rgb_(h, s, l);
  let rgbh = _hsl2rgb_(h / 2, s, l);
  return {
    backgroundColor: 'rgb(' + rgb[0] + ',' + rgb[1] + ',' + rgb[2] + ')',
    fontColor: _luminance_(rgbToHex(rgb[0], rgb[1], rgb[2]), '#fff', '#000'),
    hoverState: {
      backgroundColor: 'rgb(' + rgbh[0] + ',' + rgbh[1] + ',' + rgbh[2] + ')',
      fontColor: _luminance_(rgbToHex(rgb[0], rgb[1], rgb[2]), '#fff', '#000'),
    },
  };
};

let chartConfig = {
  type: 'bar',
  theme: 'classic',
  backgroundColor: '#fff',
  title: {
    text: 'Inbound Call Report',
    adjustLayout: true,
    backgroundColor: '#777',
  },
  subtitle: {
    text: 'Location: Dallas - Team: 11<br>June 30, 2019 5:16PM - July 6, 2019 5:16PM',
    adjustLayout: true,
  },
  plot: {
    tooltip: {
      text: '%kl<br><br>%v<br>Minutes',
      borderRadius: '5px',
      decimals: 2,
      fontColor: '#000',
      jsRule: 'myfunc()',
      shadow: false,
      sticky: true,
      timeout: 500,
    },
    jsRule: 'myfunc()',
    lineWidth: '3px',
    marker: {
      type: 'none',
    },
    maxTrackers: 9999,
    mode: 'normal',
    shadow: false,
  },
  plotarea: {
    adjustLayout: true,
    marginRight: '35px',
  },
  scaleX: {
    guide: {
      visible: false,
    },
    label: {
      text: 'Call Time by Hour',
      fontColor: '#333',
    },
    lineColor: '#333',
    maxItems: 7,
    minValue: '1561940182000px',
    step: 'hour',
    tick: {
      lineColor: '#333',
    },
    transform: {
      type: 'date',
      all: '%M %d %Y<br>%h:%i %A',
      item: {
        visible: false,
      },
    },
    zooming: true,
  },
  scaleY: {
    guide: {
      lineColor: '#c4c4c4',
      lineStyle: 'solid',
    },
    label: {
      text: 'Minutes on the Phone',
      fontColor: '#333',
    },
    lineColor: '#333',
    step: 50,
    tick: {
      lineColor: '#333',
    },
  },
  zoom: {
    backgroundColor: '#20DFC6',
  },
  scrollX: {
    bar: {
      backgroundColor: '#777',
    },
    handle: {
      backgroundColor: '#76DF20',
    },
  },
  series: [
    {
      values: [
        130.39037190843374, 137.82352810259908, 115.42552042752504,
        105.8985303575173, 103.17760393489152, 106.5157283982262,
        115.92864951118827, 123.19986194372177, 130.39037190843374,
        137.82352810259908, 137.13911484461278, 136.41467599198222,
        132.66717618796974, 129.72170210443437, 131.15643296856433,
        122.8077205363661, 125.21956569515169, 115.42552042752504,
        116.27919161692262, 115.37922341842204, 123.280792334117,
        125.80900968052447, 126.5779703296721, 136.0639208741486,
        134.91431394591928, 143.1818949058652, 141.5956212207675,
        144.00946975219995, 142.58891925681382, 136.97318396065384,
        132.6707432139665, 133.59662600792944, 131.67003435548395,
        128.6872488167137, 138.6640751780942, 133.68509215768427,
        142.87961044348776, 144.83349648769945, 149.6387172723189,
        157.63311076909304, 167.24209581501782, 176.82213213294744,
        184.54013934358954, 188.76858743838966, 185.7986462675035,
        181.9442157773301, 183.81773353554308, 190.00635411590338,
        196.7253781761974, 197.046047761105, 207.00932875275612,
        212.01005658134818, 208.9711654977873, 215.2892983937636,
        210.6406500050798, 212.5627496931702, 203.31407259684056,
        203.61929894890636, 201.94171560928226, 206.40297472011298,
        215.6654707621783, 221.01836185436696, 230.01836185436696,
        242.87961044348776, 237.87961044348776, 219.09721012692899,
        214.93723195511848, 209.47212534025311, 204.76167376618832,
        195.5567279458046, 195.63107108697295, 195.36074035335332,
        195.68158132955432, 186.48385820444673, 187.37324917223305,
        177.69300658721477, 173.9657269883901, 146.73953369259834,
        142.55781156010926, 141.23191310092807, 145.27394111268222,
        140.00836457125843, 145.08349590469152, 148.69954527821392,
        144.63809083215892, 141.91962704528123, 150.7710352819413,
        152.36544562503695, 149.3799415929243, 150.6317104632035,
        154.50830295216292, 153.08651010505855, 146.96675116661936,
        137.29447277262807, 140.7835721084848, 141.16032130550593,
        136.29475314635783, 128.89791775960475, 153.08651010505855,
        146.96675116661936, 137.29447277262807, 140.7835721084848,
        141.16032130550593, 136.29475314635783, 128.89791775960475,
        125.37268431857228, 123.03045104723424, 119.46262229699641,
        115.46265214699641, 119.21671440359205, 128.82347344886512,
        121.73517451621592, 117.21783087588847, 127.03464472200722,
        117.21783087588847, 126.21696717105806, 129.02965650893748,
        124.59247510880232, 118.40024844743311, 110.40024844743311,
        110.40024844743311, 106.40024844743311, 127.65546347945929,
        132.93117898516357, 134.1007771762088, 140.69107306189835,
        140.28070971369743, 144.2097987793386, 142.87268072832376,
        141.4521514531225, 147.82087058294564, 140.0491758994758,
        132.14203683193773, 132.13804602622986, 132.43992226663977,
        140.8460800582543, 134.65536702424288, 125.61551874503493,
        129.12139180116355, 121.95768306031823, 125.61551874503493,
        129.12139180116355, 121.95768306031823, 112.34819089528173,
        118.24232061393559,
      ],
    },
  ],
};

zingchart.render({
  id: 'myChart',
  data: chartConfig,
  height: '100%',
  width: '100%',
});