<!DOCTYPE html>
<html>
<head>
<meta charset="utf-8">
<title>ZingSoft Demo</title>
<script nonce="undefined" src="https://cdn.zingchart.com/zingchart.min.js"></script>
<style>
.chart--container {
width: 100%;
height: 100%;
min-height: 530px;
}
#myChart button {
z-index: 1000;
}
.zc-ref {
display: none;
}
</style>
</head>
<body>
<div id="myChart" class="chart--container">
<a class="zc-ref" href="https://www.zingchart.com/">Powered by ZingChart</a>
<button onclick="window.parent.location.reload()">Reload Data</button>
</div>
<script>
ZC.LICENSE = ["569d52cefae586f634c54f86dc99e6a9", "b55b025e438fa8a98e32482b5f768ff5"]; // define chart JSON
let chartConfig = {
type: 'bar',
title: {
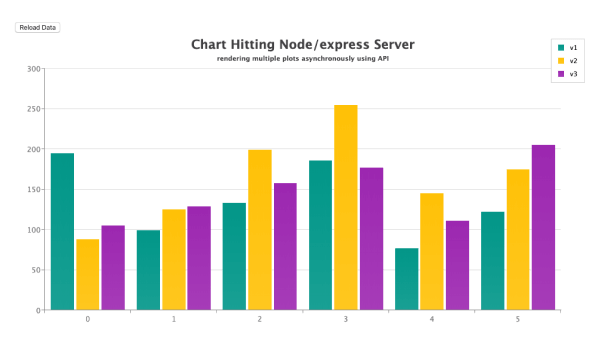
text: 'Chart Hitting Node/express Server',
},
subtitle: {
text: 'rendering multiple plots asynchronously using API',
},
legend: {
toggleAction: 'remove',
},
plot: {
tooltip: {
fontColor: '#fff',
},
animation: {},
},
scaleY: {
values: '0:300:50',
guide: {
lineStyle: 'solid',
},
},
series: [{
text: '',
values: [],
}, ],
};
// using basic custom theme
let myTheme = {
palette: {
vbar: [
['#009688', '#009688'],
['#FFC107', '#FFC107'],
['#9C27B0', '#9C27B0'],
],
},
};
/* to keep track of the next series */
let curSeries = 0;
/*
* callback for GET request is when we will render the chart
*/
function renderFirstPlotInChart() {
chartConfig.series[0].values = JSON.parse(this.responseText).series[curSeries].values;
chartConfig.series[0].text = JSON.parse(this.responseText).series[curSeries].text;
curSeries++;
zingchart.render({
id: 'myChart',
data: chartConfig,
defaults: myTheme, // define custom theme from above
height: '100%',
width: '100%',
});
}
// make the AJAX request
let oReq = new XMLHttpRequest();
oReq.addEventListener('load', renderFirstPlotInChart);
oReq.open('GET', 'https://cdn.zingchart.com/datasets/remote-config.json');
oReq.send();
/*
* append the plots using ZingChart API method addplot
* https://www.zingchart.com/docs/api/methods/#zingchart__exec__api__addplot
*/
function addAnotherPlot() {
zingchart.exec('myChart', 'addplot', {
data: {
text: JSON.parse(this.responseText).series[curSeries].text,
values: JSON.parse(this.responseText).series[curSeries].values,
},
});
curSeries++
}
/*
* Bind plots after the chart has rendered
*/
zingchart.bind('myChart', 'load', () => {
/*
* make AJAX request for the last two plots
* Use setTimeouts to show what the effect
* would look like when using large dataset
*/
setTimeout(() => {
// call for second dataset
oReq = new XMLHttpRequest();
oReq.addEventListener('load', addAnotherPlot);
oReq.open('GET', 'https://cdn.zingchart.com/datasets/remote-config.json');
oReq.send();
// call for third dataset
setTimeout(() => {
oReq = new XMLHttpRequest();
oReq.addEventListener('load', addAnotherPlot);
oReq.open('GET', 'https://cdn.zingchart.com/datasets/remote-config.json');
oReq.send();
}, 100);
}, 2000);
});
</script>
</body>
</html>
// define chart JSON
let chartConfig = {
  type: 'bar',
  title: {
    text: 'Chart Hitting Node/express Server',
  },
  subtitle: {
    text: 'rendering multiple plots asynchronously using API',
  },
  legend: {
    toggleAction: 'remove',
  },
  plot: {
    tooltip: {
      fontColor: '#fff',
    },
    animation: {},
  },
  scaleY: {
    values: '0:300:50',
    guide: {
      lineStyle: 'solid',
    },
  },
  series: [
    {
      text: '',
      values: [],
    },
  ],
};

// using basic custom theme
let myTheme = {
  palette: {
    vbar: [
      ['#009688', '#009688'],
      ['#FFC107', '#FFC107'],
      ['#9C27B0', '#9C27B0'],
    ],
  },
};

/* to keep track of the next series  */
let curSeries = 0;

/*
 * callback for GET request is when we will render the chart
 */
function renderFirstPlotInChart() {
  chartConfig.series[0].values = JSON.parse(this.responseText).series[curSeries].values;
  chartConfig.series[0].text = JSON.parse(this.responseText).series[curSeries].text;
  curSeries++;
  zingchart.render({
    id: 'myChart',
    data: chartConfig,
    defaults: myTheme, // define custom theme from above
    height: '100%',
    width: '100%',
  });
}

// make the AJAX request
let oReq = new XMLHttpRequest();
oReq.addEventListener('load', renderFirstPlotInChart);
oReq.open('GET', 'https://cdn.zingchart.com/datasets/remote-config.json');
oReq.send();
/*
 * append the plots using ZingChart API method addplot
 * https://www.zingchart.com/docs/api/methods/#zingchart__exec__api__addplot
 */
function addAnotherPlot() {
  zingchart.exec('myChart', 'addplot', {
    data: {
      text: JSON.parse(this.responseText).series[curSeries].text,
      values: JSON.parse(this.responseText).series[curSeries].values,
    },
  });
  curSeries++
}

/*
 * Bind plots after the chart has rendered
 */
zingchart.bind('myChart', 'load', () => {
  /*
   * make AJAX request for the last two plots
   * Use setTimeouts to show what the effect
   * would look like when using large dataset
   */
  setTimeout(() => {
    // call for second dataset
    oReq = new XMLHttpRequest();
    oReq.addEventListener('load', addAnotherPlot);
    oReq.open('GET', 'https://cdn.zingchart.com/datasets/remote-config.json');
    oReq.send();

    // call for third dataset
    setTimeout(() => {
      oReq = new XMLHttpRequest();
      oReq.addEventListener('load', addAnotherPlot);
      oReq.open('GET', 'https://cdn.zingchart.com/datasets/remote-config.json');
      oReq.send();
    }, 100);
  }, 2000);
});