<!DOCTYPE html>
<html>
<head>
<meta charset="utf-8">
<title>ZingSoft Demo</title>
<script nonce="undefined" src="https://cdn.zingchart.com/zingchart.min.js"></script>
<style>
.chart--container {
min-height: 530px;
width: 100%;
height: 100%;
}
.zc-ref {
display: none;
}
</style>
</head>
<body>
<div id="myChart" class="chart--container">
<a class="zc-ref" href="https://www.zingchart.com/">Powered by ZingChart</a>
</div>
<script>
ZC.LICENSE = ["569d52cefae586f634c54f86dc99e6a9", "b55b025e438fa8a98e32482b5f768ff5"];
let chartConfig = {
type: 'bar',
backgroundColor: 'white',
title: {
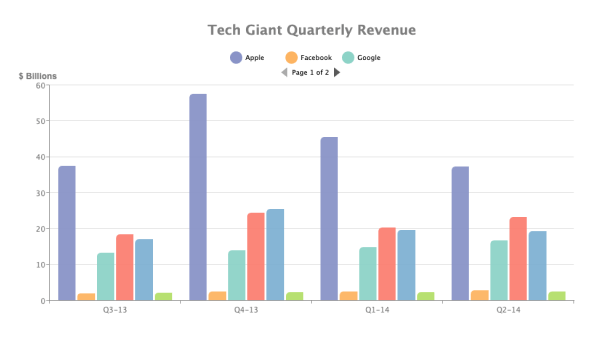
text: 'Tech Giant Quarterly Revenue',
alpha: 1,
backgroundColor: 'none',
fontColor: '#7E7E7E',
fontSize: '22px',
margin: '15px auto',
},
legend: {
alpha: 0.05,
borderWidth: '0px',
layout: 'x3',
margin: '65px auto auto auto',
marker: {
type: 'circle',
borderColor: 'none',
size: '10px',
},
maxItems: 3,
overflow: 'page',
pageOff: {
alpha: 0.65,
backgroundColor: '#7E7E7E',
size: '10px',
},
pageOn: {
alpha: 0.65,
backgroundColor: '#000',
size: '10px',
},
pageStatus: {
color: 'black',
},
shadow: false,
toggleAction: 'remove',
},
plot: {
tooltip: {
text: '$%v Billion',
},
animation: {
effect: 'ANIMATION_SLIDE_BOTTOM',
},
},
plotarea: {
margin: '80 60 100 60',
y: '125px',
},
scaleX: {
guide: {
visible: false,
},
item: {
fontColor: '#7e7e7e',
},
labels: ['Q3-20', 'Q4-20', 'Q1-21', 'Q2-21'],
lineColor: '#7E7E7E',
},
scaleY: {
values: '0:60:10',
guide: {
visible: true,
},
item: {
fontColor: '#7e7e7e',
},
label: {
text: '$ Billions',
bold: true,
fontAngle: 0,
fontColor: '#7E7E7E',
fontFamily: 'arial',
fontSize: '14px',
offsetX: '20px',
offsetY: '-190px',
},
lineColor: '#7E7E7E',
},
series: [{
text: 'Apple',
values: [37.47, 57.59, 45.65, 37.43],
alpha: 0.95,
backgroundColor: '#8993c7',
borderRadiusTopLeft: '7px',
},
{
text: 'Facebook',
values: [2.02, 2.59, 2.5, 2.91],
alpha: 0.95,
backgroundColor: '#fdb462',
borderRadiusTopLeft: '7px',
},
{
text: 'Google',
values: [13.4, 14.11, 14.89, 16.86],
alpha: 0.95,
backgroundColor: '#8dd3c7',
borderRadiusTopLeft: '7px',
},
{
text: 'Microsoft',
values: [18.53, 24.52, 20.4, 23.38],
alpha: 0.95,
backgroundColor: '#fb8072',
borderRadiusTopLeft: '7px',
},
{
text: 'Amazon',
values: [17.09, 25.59, 19.74, 19.34],
alpha: 0.95,
backgroundColor: '#80b1d3',
borderRadiusTopLeft: '7px',
},
{
text: 'Cognizant',
values: [2.31, 2.36, 2.42, 2.52],
alpha: 0.95,
backgroundColor: '#b3de69',
borderRadiusTopLeft: '7px',
},
],
};
zingchart.render({
id: 'myChart',
data: chartConfig,
height: '100%',
width: '100%',
});
</script>
</body>
</html>
let chartConfig = {
  type: 'bar',
  backgroundColor: 'white',
  title: {
    text: 'Tech Giant Quarterly Revenue',
    alpha: 1,
    backgroundColor: 'none',
    fontColor: '#7E7E7E',
    fontSize: '22px',
    margin: '15px auto',
  },
  legend: {
    alpha: 0.05,
    borderWidth: '0px',
    layout: 'x3',
    margin: '65px auto auto auto',
    marker: {
      type: 'circle',
      borderColor: 'none',
      size: '10px',
    },
    maxItems: 3,
    overflow: 'page',
    pageOff: {
      alpha: 0.65,
      backgroundColor: '#7E7E7E',
      size: '10px',
    },
    pageOn: {
      alpha: 0.65,
      backgroundColor: '#000',
      size: '10px',
    },
    pageStatus: {
      color: 'black',
    },
    shadow: false,
    toggleAction: 'remove',
  },
  plot: {
    tooltip: {
      text: '$%v Billion',
    },
    animation: {
      effect: 'ANIMATION_SLIDE_BOTTOM',
    },
  },
  plotarea: {
    margin: '80 60 100 60',
    y: '125px',
  },
  scaleX: {
    guide: {
      visible: false,
    },
    item: {
      fontColor: '#7e7e7e',
    },
    labels: ['Q3-20', 'Q4-20', 'Q1-21', 'Q2-21'],
    lineColor: '#7E7E7E',
  },
  scaleY: {
    values: '0:60:10',
    guide: {
      visible: true,
    },
    item: {
      fontColor: '#7e7e7e',
    },
    label: {
      text: '$ Billions',
      bold: true,
      fontAngle: 0,
      fontColor: '#7E7E7E',
      fontFamily: 'arial',
      fontSize: '14px',
      offsetX: '20px',
      offsetY: '-190px',
    },
    lineColor: '#7E7E7E',
  },
  series: [
    {
      text: 'Apple',
      values: [37.47, 57.59, 45.65, 37.43],
      alpha: 0.95,
      backgroundColor: '#8993c7',
      borderRadiusTopLeft: '7px',
    },
    {
      text: 'Facebook',
      values: [2.02, 2.59, 2.5, 2.91],
      alpha: 0.95,
      backgroundColor: '#fdb462',
      borderRadiusTopLeft: '7px',
    },
    {
      text: 'Google',
      values: [13.4, 14.11, 14.89, 16.86],
      alpha: 0.95,
      backgroundColor: '#8dd3c7',
      borderRadiusTopLeft: '7px',
    },
    {
      text: 'Microsoft',
      values: [18.53, 24.52, 20.4, 23.38],
      alpha: 0.95,
      backgroundColor: '#fb8072',
      borderRadiusTopLeft: '7px',
    },
    {
      text: 'Amazon',
      values: [17.09, 25.59, 19.74, 19.34],
      alpha: 0.95,
      backgroundColor: '#80b1d3',
      borderRadiusTopLeft: '7px',
    },
    {
      text: 'Cognizant',
      values: [2.31, 2.36, 2.42, 2.52],
      alpha: 0.95,
      backgroundColor: '#b3de69',
      borderRadiusTopLeft: '7px',
    },
  ],
};

zingchart.render({
  id: 'myChart',
  data: chartConfig,
  height: '100%',
  width: '100%',
});