Mobile Charts
Overview
ZingChart offers a mobile chart that allows users to interact with and use touch gestures on when reading JavaScript charts on mobile devices. Try interacting with the following chart on a mobile device.
Scope
Mobile charting is intended for use on web pages that will be primarily viewed on mobile devices, such as tablets and phones. We support touch gestures such as tap, swipe, pinch, stretch, and drag.
We currently support mobile charting on the following chart types:
Setup
Get started by adding this code above the render method zingchart.TOUCHZOOM = 'pinch';.
var myConfig = {...};

// enable native mobile plugin (NO MORE MOBILE PLUGIN REQUIRED)
zingchart.TOUCHZOOM = 'pinch';

// now call render on the chart
zingchart.render({
  id: 'myChart',
  data: myConfig,
  height: 400,
  width: '100%'
});
The chart should render differently. It should have a mobile menu in the top left corner. The chart will now look like this:

Enabling Crosshairs
In order to enable crosshairs, set the crosshair objects in the respective JSON.
var myConfig = {
  type: 'line',
  crosshairX: {}
};
Enabling Zooming
In order to enable zooming, set zooming objects in the respective scale-x and/or scale-y.
var myConfig = {
  type: 'line',
  scaleX: {
    zooming: true,
  },
  scrollX: {},
  scrollY: {},
  scaleY: {
    zooming: true,
  }
};
To FULLY enable zooming, there is one extra step. Click the menu button in the top left hand corner of the chart and disable page scrolling. This will allow you to zoom into the chart using pinch. If you would like to scroll the page again, enable page scrolling via the same menu.
X/Y-Axis Charts
The code supports mobile charting on bar ('bar'), line ('line'), area ('area'), scatter ('scatter'), and bubble ('bubble') charts. These charts appear with mobile crosshairs and an accompanying scrollbar if crosshairs or zooming is enabled via the JSON.
Mobile Crosshairs
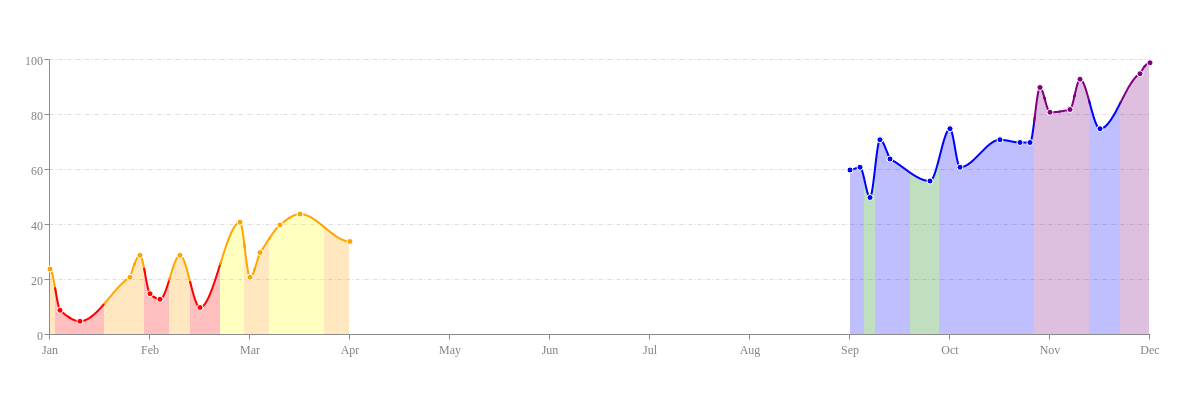
Tooltips appear across all ZingChart charts by default. On x/y-axis mobile charts, crosshairs appear if you set them on in the chart JSON. Try interacting with the below area chart on a mobile device to see how the crosshairs appear. You can touch a node to activate the crosshairs, as well as drag the crosshairs across the entirety of the chart.
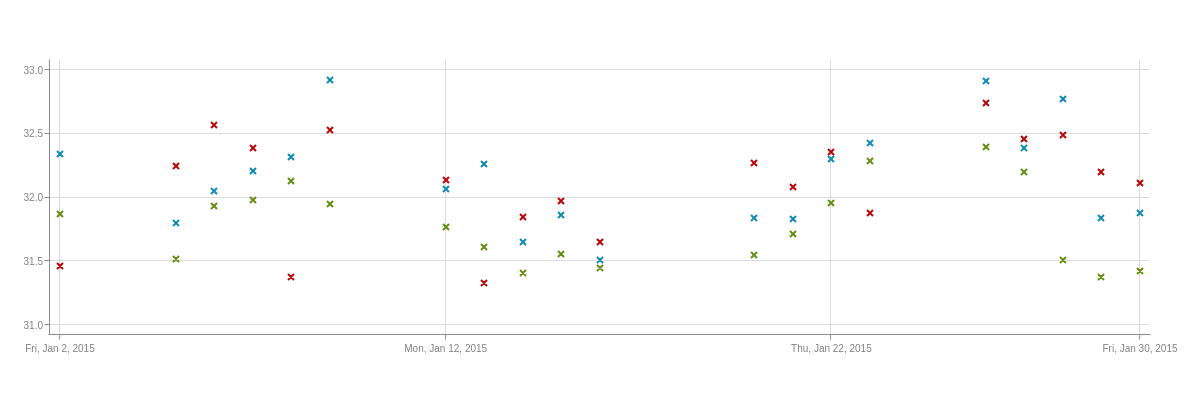
To customize the crosshairs, use the standard crosshairX object in your chart object. You can use the plotLabel and scaleLabel objects to format and style the labels, as well as the guideLabel object(s) in individual series objects for series-specific customization. See the below time-series scatter plot. Refer to the Crosshairs Tutorial for more information.
Mobile Zooming/Scrollbar
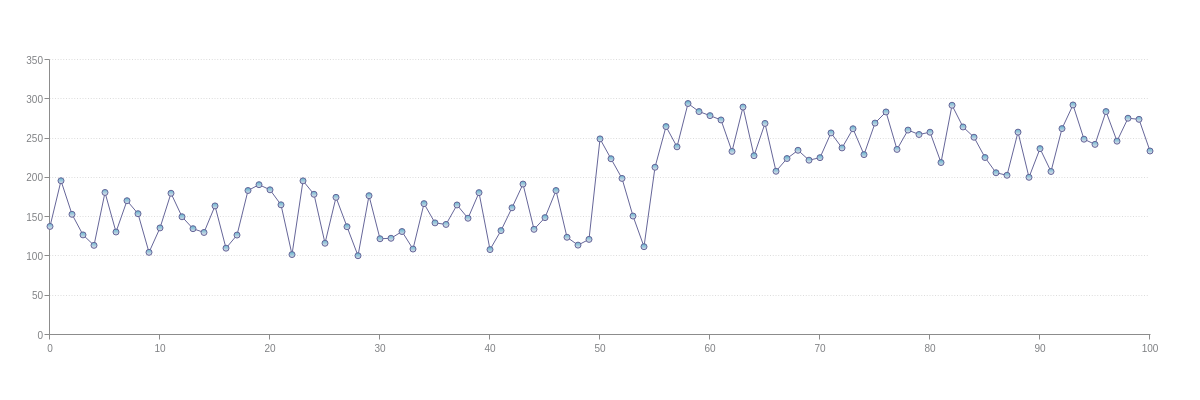
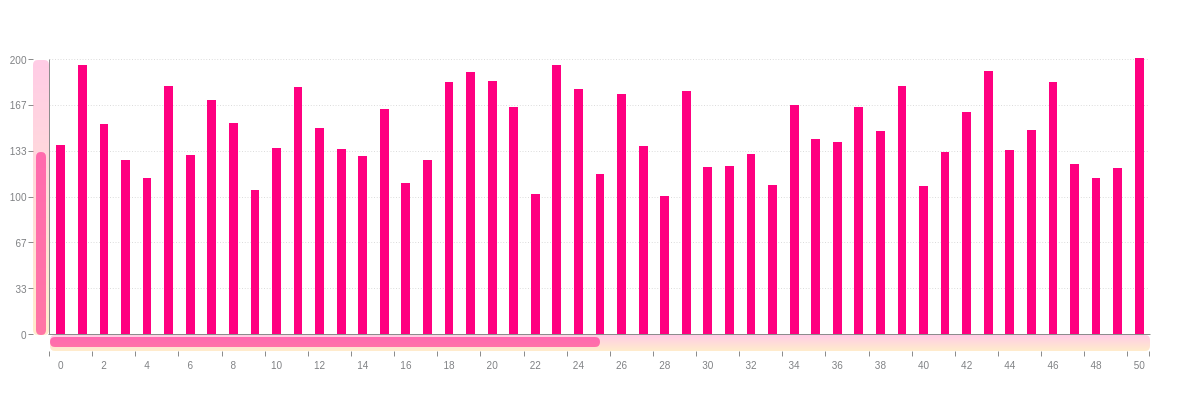
When zooming is enabled on an x/y-axis chart, a scrollbar will appear on the mobile version of that chart when zoomed. In order to turn on zooming, click the small menu button in the top left hand that is added with the mobile code. In this menu, set page scrolling to disabled so now you can pinch and zoom. See the below line chart, where zooming attributes were added to both the scaleX and scaleY objects. Try spreading and pinching the chart on your mobile device. You'll see the scrollbar appear once you've zoomed in on a section of the chart.
Note: To have the chart zoomed into specified scale values at chart render, you would need to add a zoomTo or zoomToValues array in your scale object(s). Refer to the Zooming, Scrollbar, and Preview Chart Tutorial for more information.
To customize the scrollbar, use the standard scrollX and/or scrollY object(s) in your chart object. Refer to the Zooming, Scrollbar, and Preview Chart Tutorial for step-by-step instructions.
Pie/Donut Charts
The mobile code supports mobile charting on pie ('pie') and donut ('ring') charts.
Note: The mobile code is not currently supported on the 3D versions of these charts.
Summary
ZingChart makes it easy to make mobile friendly charts by setting the TOUCHZOOM variable. This allows ZingChart to distinguish mobile interactions to make all of our features usable on a mobile device.