This is Part 5 of the ZingChart Beginner’s Guide - the final installment. In this guide, we’ll cover the basics of the ZingChart API by introducing ZingChart methods and events. At the end of this guide, we’ll have made four custom buttons that alter our chart when clicked.
If you’re looking for another part of the ZingChart Beginner’s Guide, try one of the links below:
-
Part 5: Basic API Usage (this tutorial)
Create Rich User Experiences with the ZingChart API
The ZingChart library includes an incredibly comprehensive feature set. When paired with the extensive API, creating interactive, meaningful experiences becomes easier than ever.
ZingChart Events
An event in JavaScript is like an event in real life - it’s simply something that happens. There are lots of things that can happen in ZingChart, either passively (the chart finished loading) or actively (the user clicked a node).
The ZingChart API gives you access to these events so you can create rich, interactive experiences for your users.
Listening for an Event
In the last tutorial, we made four “buttons” using ZingChart labels. Before we move forward, let's give each label a unique ID. More on that to come.
By the end of this guide, the buttons will adjust the amounts of projected revenue in Q4 10% in either direction when clicked. Right now, however, the buttons don’t do anything of interest. At the most basic level, we just want something to happen when they’re clicked.
But how do we know if they’ve been clicked? We don’t because we aren’t listening. Enter ZingChart events! If we check the ZingChart API Events doc, we find the label_click event.
You should already be familiar with the ZingChart render method, to which you pass an object of options such as chart data and dimensions. That object also accepts an events key which takes an object itself - an object of events! Let’s include the label_click event.
Tip: The ZingChart API Events doc is a great resource that lists all available events. It also explains the three different ways you can use these events with your chart(s). We highly recommend reading this page if you plan on using the API.
Want To See Something Cool?
-
Open up the developer console in your browser
-
Click the buttons in the chart above.
-
You should be greeted by a heart hello.
Go ahead, we’ll wait!
Accessing Object Properties
Before covering button behavior, we need to address how to tell which button a click is coming from. Right now, clicking on any of the four labels we made will raise the same event and result in the same action.
Fortunately, all ZingChart events return an event object that contains various properties about the object that raised them. For example, if we were to print the contents of the event object returned for one of our labels, we should see something like this in our console:
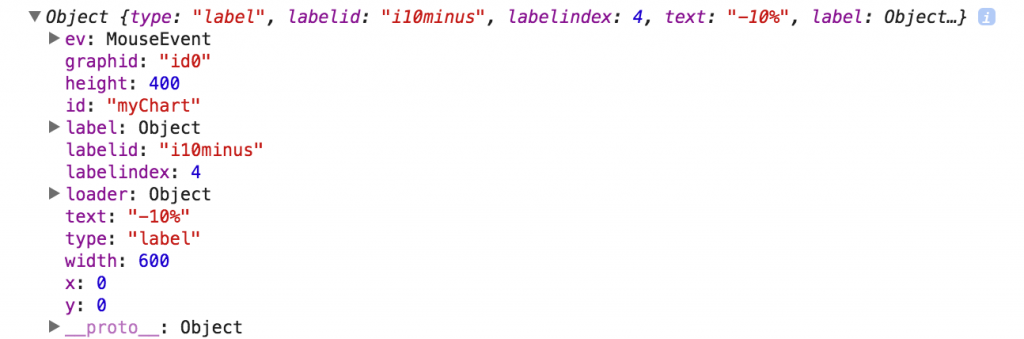
The key we’re interested in here is labelid. By assigning each label we created in our JSON a unique ID, we can now check the event object returned by the click event to determine which label fired it.
Since we have four labels, we can use a switch statement and handle each click in a different way.
zingchart.render({
  id : 'myChart',
  data : myConfig,
  height: 400,
  width: 600,
  events: {
      label_click: function(p){
          var nodeValue;
          switch(p.labelid){
              case 'i10minus':
                  //do something
                  break;
              case 'i10plus':
                  //do something
                  break;
              case 'c10minus':
                  //do something
                  break;
              case 'c10plus':
                  //do something
                  break;
          }
      }
  }
});
ZingChart Methods
Now that we’re listening for a label_click event on each of our four buttons, we can write the JavaScript that will handle the event itself and modify our chart. The ZingChart API provides methods that allow you to retrieve information about the chart as well as modify the chart itself.
zingchart.exec()
The first thing to know about ZingChart methods is that they must be called using zingchart.exec(). The exec() method takes three arguments:
-
The ID of the chart you are calling the method on. This is the ID you have assigned to the HTML div in which you render your chart.
-
The name of the API method you are calling.
-
An object of options to pass to the method. This argument may be optional, depending on the method you are calling.
Tip: Did you know that each event object has an id property that holds the id of the chart that raised the event? This is helpful if you are working with multiple charts and don't want to keep track of all div ids manually.
Now that we know how to use ZingChart API methods, let’s get back to our chart and make our buttons useful.
ZingChart Methods in Action
As we mentioned before, our goal is to have the buttons adjust the amounts of projected revenue in Q4 by 10%. In order to make those adjustments, however, we first need to know the value of the node we’re supposed to modify.
By referencing the ZingChart API Methods doc, we find the getnodevalue method. The getnodevalue method takes an options object where we can specify the plotindex and nodeindex of the node we’re trying to get the value of. Remember - these are 0 based indices.
zingchart.render({
id : 'myChart',
data : myConfig,
height: 400,
width: 600,
events: {
  label_click: function(p){
    console.log(p);
      var nodeValue;
      switch(p.labelid){
        case 'i10minus':
          nodeValue = zingchart.exec("myChart","getnodevalue",{
            "plotindex":0,
            "nodeindex":3,
          });
          //modify chart
          break;
        case 'i10plus':
          nodeValue = zingchart.exec("myChart","getnodevalue",{
            "plotindex":0,
            "nodeindex":3,
          });
          //modify chart
          break;
        case 'c10minus':
          nodeValue = zingchart.exec("myChart","getnodevalue",{
            "plotindex":1,
            "nodeindex":3,
          });
          //modify chart
          break;
        case 'c10plus':
          nodeValue = zingchart.exec("myChart","getnodevalue",{
            "plotindex":1,
            "nodeindex":3,
          });
          //modify chart
          break;
      }
    }
  }
});
Now that we have the current value of the node, we can calculate and add or subtract 10% from it, depending on which button was clicked.
But how do we update the node with the new value? Another check of the API methods page and we find the setnodevalue method. Perfect!
zingchart.render({
id : 'myChart',
data : myConfig,
height: 400,
width: 600,
events: {
  label_click: function(p){
    console.log(p);
      var nodeValue;
      switch(p.labelid){
        case 'i10minus':
          nodeValue = zingchart.exec("myChart","getnodevalue",{
            "plotindex":0,
            "nodeindex":3,
          });
          //modify chart
          break;
        case 'i10plus':
          nodeValue = zingchart.exec("myChart","getnodevalue",{
            "plotindex":0,
            "nodeindex":3,
          });
           zingchart.exec('myChart',"setnodevalue",{
            "plotindex":0,
            "nodeindex":3,
            "value":(nodeValue + (nodeValue * 0.1))
          });
          break;
        case 'c10minus':
          nodeValue = zingchart.exec("myChart","getnodevalue",{
            "plotindex":1,
            "nodeindex":3,
          });
          zingchart.exec('myChart',"setnodevalue",{
            "plotindex":1,
            "nodeindex":3,
            "value":(nodeValue - (nodeValue * 0.1))
          });
          break;
        case 'c10plus':
          nodeValue = zingchart.exec("myChart","getnodevalue",{
            "plotindex":1,
            "nodeindex":3,
          });
          zingchart.exec('myChart',"setnodevalue",{
            "plotindex":1,
            "nodeindex":3,
            "value":(nodeValue + (nodeValue * 0.1))
          });
          break;
      }
    }
  }
});
And there we have it. Try the buttons now and keep an eye on projected revenue.
Start Building Charts in ZingChart
You've finished the series! We hope this set of tutorials has helped to get you comfortable using the ZingChart library and the ZingChart docs.
Remember to check the JSON attributes or the Features pages if you get stuck or are curious about a certain object. Now is also a great time to check out our integrations and software specific demos.
Want some more in-depth ZingChart education? Visit our docs page! Have some more questions? Visit our help center!
Go forth and build some creative and interactive charts!