Choropleth Module Update
Update: ZingChart now has choropleth functionality built in! Check out our Choropleth Tutorial that walks through how to add and use the choropleth module. The following post content is retained for historical/reference reasons - we recommend using the built-in module for ease of use!
Choropleth maps are a timeless data visualization format, and for good reason. They quickly and efficiently visualize data with geographical dimension. Can you imagine election data without maps? Census data without color-coded regions? Choropleth maps are an important tool in any dataviz arsenal.
Luckily, using choropleth maps has gotten easier over time. They used to require complex geographic information software. But in this post, we will show you how to make your own choropleths with SODA, ZingChart maps, and a little bit of your own JavaScript.
Building a Choropleth Map
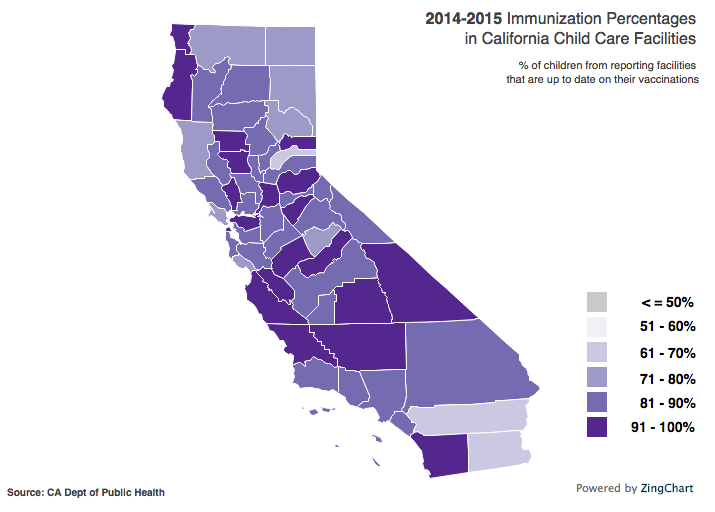
In this tutorial, we will build the choropleth map seen below. We will use ZingChart, GeoJSON, and data parsed with Node.js:
If you're looking for a specific section, feel free to jump around!
Choosing a Data Set
As is the case with any data visualization, the first step in making a choropleth map is selecting your data. We recently discovered the Socrata OpenData API (SODA). The selection of data available is impressive. So many datasets, so little time…

We selected this California Dept. of Public Health dataset for our example map. This set contains the results of a 2014-2015 survey of child care facilities in all 58 California counties in which they were asked to provide the vaccination status of the children attending.
We’re going to walk through the steps of building a choropleth map to visualize what percentage of preschool children, on average, are up to date on their vaccinations in the state of California, by county. Let’s get to it!
Project Setup
What do you need to make a map? Not much! The primary components include:
-
A GeoJSON file of California counties
-
A Node.js script to parse our data
-
An HTML file to serve our map
Directory Setup
We really only need one directory for this project. Inside of it, create index.html for your map, a file named index.js for your Node script, and save your GeoJSON in the same folder.
Looking for GeoJSON?
Files can be found around the web, including at the following sites:
-
Don’t forget - ZingChart accepts TopoJSON too!
Handling the data
Socrata Data API
We’re going to be using the Socrata Data API to retrieve the data we need in JSON format, but first, we need to decide which data we actually want. By reviewing the full data set on the California Department of Public Health website, we found a column that lists the county in which the facility is located, county, and a column that contains the percentage of children in attendance who are up-to-date on their vaccinations, up_to_date_2. We’ll use those in our endpoint.
Parsing the data
Now that we’ve got our endpoint, it’s time to whip some data into shape! Let’s review what we need to do to translate this data into a choropleth map:
-
The data we get back contains a record for each facility, but we only want one value for each county, so we’ll need to get the average for each county.
-
We’ll need to generate style JSON to pass to the ZingChart style object to achieve the choropleth effect.
Calculating county averages
We’ll be using the following node modules; make sure to install them before you require them in your index.js file:
var _ = require('underscore');
var async = require('async'); //waterfall() to manage our functions
var request = require('request');
var fs = require('fs');
First, we’ll write a simple request function to get the raw data set:
var getData = function(callback) {
  var url =
    'https://cdph.data.ca.gov/resource/v5bp-qkhg.json?$limit=50000&$select=county,up_to_date_2&$where=reported=%27Y%27';
  request(url, function(err, res, body) {
    if (!err && res.statusCode == 200) {
      callback(null, body);
    }
  });
}
When it runs, it will return an array of objects like so:
{"county":"ALAMEDA","up_to_date_2":"88"} //single facility record
,{"county":"ALAMEDA","up_to_date_2":"96"}
,{"county":"ALAMEDA","up_to_date_2":"100"}
,{"county":"ALAMEDA","up_to_date_2":"88"}
...
Let’s condense that down to an array for each county:
var condenseData = function(body, callback) {
  var rawJSON = JSON.parse(body);
  var countyData = {};
  var currentCounty;
  for (var i = 0; i < rawJSON.length; i++) {
    currentCounty = rawJSON[i].county;
    if (countyData.hasOwnProperty(currentCounty)) {
      countyData[currentCounty].push(parseInt(rawJSON[i].up_to_date_2, 10));
    }
    else {
      countyData[currentCounty] = [parseInt(rawJSON[i].up_to_date_2, 10)];
    }
  }
  callback(null, countyData);
}
This function will return an object of alpha sorted keys like so:
{ ALAMEDA: [ 88,96,100,88,80,87,100,100,93,98,86,94,97, …],
  AMADOR: [ 81, 100, 100, 87, 70, 95, 79, 100, 85, …], ... }
And in that format, getting an average for each county is a cinch:
var calcAvgs = function(countyData, callback) {
  var countyAvgs = [];
  var sum;
  var avg;
  _.each(countyData, function(value, key) {
    sum = _.reduce(value, function(memo, num) {
      return memo + num;
    }, 0);
    avg = sum / (value.length);
    avg = Math.round(avg * 1e2) / 1e2;<a id="generating"></a>
    countyAvgs.push(avg);
  });
  callback(null, countyAvgs);
}
Generating choropleth JSON
We’ve got our actual data together now, but how do we turn it into a choropleth? As we mentioned earlier, we need to generate JSON containing styling information to pass to the ZingChart style object. Each county in our map will be represented by an object inside of the items array, like so:
"options": {
  "name": "california",
  "scale": true,
  "style": {
    "items": [{
      //county style data
    }, {
      //county style data
    }, ...]
  }
}
This is where we’ll set the background color of the county to reflect its percentage. But how will ZingChart know which style object belongs to which county? This is where we’ll need to reference our GeoJSON.
Referencing GeoJSON feature IDs
When you call the loadGeoJSON method, ZingChart creates shapes for each feature in the GeoJSON file and internally assigns them the ID listed in their corresponding feature object. Therefore, in order for ZingChart to know which shape the style object you’ve provided refers to, you must set the ID of the object to the ID of the corresponding shape/feature.
GeoJSON Feature Object
{
  "type": "Feature",
  "id": "US.CA.083", //the id of the feature object (county)
  "properties": {
    "hc-group": "admin2",
    "hc-middle-x": 0.51,
    "hc-middle-y": 0.29,
    ...
  },
  ...
}
ZingChart Style Object
"items": {
  "US_CA_083": {
    "backgroundColor": "#756bb1",
    "hover-state": {
      "border-color": "#e0e0e0",
      "border-width": 2,
      "background-color": "#756bb1"
    },
    "tooltip": {
      "text": "Santa Barbara County <br> 89.23%"
    }
  },
  ...
}
Did you notice that the key in the ZingChart object uses underscores instead of the periods that are in the original ID? That is because ZingChart converts all separators in GeoJSON feature IDs to ‘_’ for compatibility with existing code.
Make sure you do the same when generating your style JSON. If you skip this step, the IDs won’t match and your map won’t load!
Creating a JSON style file
Now that we know that we need to match GeoJSON feature IDs to style objects, the next step becomes clear: iterate over the GeoJSON features and county averages simultaneously, producing a new file with county style objects in which the colors are based on that county’s average.
Setting Colors
Choropleth maps feature sequential color themes, generally with darker shades indicating larger numbers. We chose the following color palette to reflect our percentages:
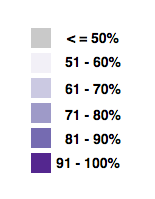
Then, we wrote a simple function to return a given value’s associated hexadecimal code (we’ll use this function in a moment):
function setColor(value) {
  if (value <= 50) {
    return "#C9C9C9";
  }
  else if (value < 61) {
    return "#f2f0f7";
  }
  else if (value > 60 && value < 71) {
    return "#cbc9e2";
  }
  else if (value > 70 && value < 81) {
    return "#9e9ac8";
  }
  else if (value > 80 && value < 91) {
    return "#756bb1";
  }
  else {
    return "#54278f";
  }
}
Generating the JSON
Next, we saved a reference to the features array of our GeoJSON file and sorted it alphabetically to reflect the order of the countyAvgs array to which we will match it:
var stripSortGeo = function(countyAvgs, callback) {
  var geoJSON = {};
  fs.readFile('public/calif_geo.json', function(err, data) {
    if (err) {
      console.log(err);
    }
    geoJSON = JSON.parse(data);
    geoJSON = geoJSON.features;
    var newGeo = _.sortBy(geoJSON, function(feature) {
      return feature.properties.name;
    });
    callback(null, countyAvgs, newGeo);
  });
}
Finally, we can generate and save our style JSON:
var generateJSON = function(countyAvgs, newGeo, callback) {
  var zingmapJSON = {};
  var average;
  var id;
  var color;
  var name;
  _.each(newGeo, function(value, key) {
    id = value.id;
    id = id.replace(/\./g, '_'); //replace . with _ for ZC compatibility
    name = value.properties.name;
    average = countyAvgs[key]; //sorting the features array let’s us use this key!
    zingmapJSON[id] = {
      "backgroundColor": setColor(average),
      "hover-state": {
        "border-color": "#e0e0e0",
        "border-width": 2,
        "background-color": setColor(average)
      },
      "tooltip": {
        "text": name + " County
" + average + "%"
      }
    }
  });
  fs.writeFile('./zingMap.json', JSON.stringify(zingmapJSON));
  callback(null, zingmapJSON);
}
At the bottom of index.js, we just need to call async.waterfall() to call all of the functions we just wrote.
async.waterfall([
  getData,
  condenseData,
  calcAvgs,
  stripSortGeo,
  generateJSON
], function(err, result) {
  console.log('\n good job! check out your JSON!');
});
Now, in your terminal, navigate to your project directory, run “node index.js”, and you should see zingMap.json waiting for you in your directory!
Putting it all together
“Alright, Chloe, we’ve done all of this and still don’t have a map. What gives?”
We’re just about there! Now that all of our data is squared away, we can set up the map. And good news: this is the easiest step! In index.html, set up a skeleton as you would for any other ZingChart chart or map.
Make sure to include both the maps and maps-geojson modules in the head. We’ll also include jQuery so we can use $.get to request our hosted JSON
file.
<html>
<head>
    <script src='http://code.jquery.com/jquery-2.1.4.min.js'>
    </script>
    <script src="https://cdn.zingchart.com/zingchart.min.js">
    </script>
    <script src="https://cdn.zingchart.com/modules/zingchart-maps.min.js">
    </script>
    <script src=
    "https://cdn.zingchart.com/modules/zingchart-maps-geojson.min.js">
    </script>
    <title></title>
</head>
<body>
    <div id='myChart'></div>
</body>
</html>
In a script tag right before the closing body tag, we’ll add our actual ZingChart JavaScript. Start by calling the ZingChart loadGeoJSON method with a map id, the URL of your GeoJSON file, and basic style options (if you choose):
zingchart.maps.loadGeoJSON({
  id: 'california', // Give the map an id
  url: 'https://www.zingchart.com/resources/calif_geo.json',
  style: { //Optional styling
    poly: {
      label: {
        visible: false
      }
    }
  },
  //callback goes here
});
Are you new to GeoJSON in ZingChart? Check out the Maps documentation for more detailed information.
In your callback, get the JSON file with style information, then call the ZingChart render() method with the data that’s returned, the id of your div, and the remainder of your map styles:
callback: function() { // Function called when GeoJSON is loaded
$.get('https://www.zingchart.com/resources/zingMap.json', function(data) {
  var items = data; //style JSON generated from geoJSON & countyAvgs
  zingchart.render({
    id: 'myChart',
    width: 700,
    height: 500,
    data: {
      "title": {
        "text": "**2014-2015** Immunization Percentages
 in California Child Care Facilities",
        "font-size": 16,
        "text-align": "right",
        "font-weight": "normal"
      },
      "source": {
        "text": "Source: CA Dept of Public Health",
        "url": "https://cdph.data.ca.gov/Healthcare/School-Immunizations-In-Child-Care-2014-2015/bvmi-h8cn",
        "text-align": "left"
      },
      "subtitle": {
        "y": 50,
        "text": "% of children from reporting facilities
 that are up to date on their vaccinations",
        "text-align": "right",
        "font-weight": "normal",
      },
      "shapes": [{
          "type": "zingchart.maps", // Set shape to map type
          "options": {
            "name": "california", // Reference to the id set in loadGeoJSON()
            "scale": true, // Automatically scale to correct proportions
            "style": {
              items: items // Our style JSON
            }
          }
        },
        //Shapes to create a custom choropleth legend
        {
          "type": "rect",
          "height": 20,
          "width": 20,
          "x": "85%",
          "y": "60%",
          "background-color": "#C9C9C9",
          "label": {
            "text": "< = 50%",
            "font-weight": "bold",
            "font-size": 14,
            "x": 667
          }
        }, {
          "type": "rect",
          "height": 20,
          "width": 20,
          "x": "85%",
          "y": "65%",
          "background-color": "#f2f0f7",
          "label": {
            "text": "51 - 60%",
            "font-weight": "bold",
            "font-size": 14,
            "x": 667,
            "y": 325
          }
        }, {
          "type": "rect",
          "height": 20,
          "width": 20,
          "x": "85%",
          "y": "70%",
          "background-color": "#cbc9e2",
          "label": {
            "text": "61 - 70%",
            "font-weight": "bold",
            "font-size": 14,
            "x": 667,
            "y": 352
          }
        }, {
          "type": "rect",
          "height": 20,
          "width": 20,
          "x": "85%",
          "y": "75%",
          "background-color": "#9e9ac8",
          "label": {
            "text": "71 - 80%",
            "font-weight": "bold",
            "font-size": 14,
            "x": 667,
            "y": 378
          }
        }, {
          "type": "rect",
          "height": 20,
          "width": 20,
          "x": "85%",
          "y": "80%",
          "background-color": "#756bb1",
          "label": {
            "text": "81 - 90%",
            "font-weight": "bold",
            "font-size": 14,
            "x": 667,
            "y": 402
          }
        }, {
          "type": "rect",
          "height": 20,
          "width": 20,
          "x": "85%",
          "y": "85%",
          "background-color": "#54278f",
          "label": {
            "text": "91 - 100%",
            "font-weight": "bold",
            "font-size": 14,
            "x": 662,
            "y": 426
          }
        }
      ]
    }
  })
});
}
});
Voila! We have a choropleth map.
Make your own choropleth map
Ready to make your own choropleth map? You can download the Node.js script for reference here. Check out our maps gallery and docs for more information! If you've already made a map, we'd love to see it! Link to your demo in the comments below.