UPDATE
Our team’s constant improvements and additions to ZingChart are great for users looking for the largest selection of features and options. But sometimes it means our “how-to” blog posts could use a little updating.
In order to make our older and highly viewed how-to posts more helpful, we are updating the Beginner’s Guide series. Updates include the most recent version of the syntax, which makes it even easier to use the cool styling capabilities of ZingChart. Follow the new tutorial series if you're interested in getting a substantial overview of using the ZingChart library.
Hello fellow ZingCharters!
Welcome to the very beginning of the ZingChart Beginner's Guide Tutorials. The goal of these tutorials is to help ZingCharters learn how to work with ZingChart. Throughout this weekly guide we will not only show you different features of the library, but we will also help you to understand how and why things are done a certain way.
Developing charts and data visualizations with ZingChart is very easy, and after learning the basic principles about how ZingChart works you will be able to quickly and easily design, develop, and implement beautiful charts and data visualizations in your websites and applications.
Before getting started with this tutorial you should have created your "Hello ZingChart World" chart. You can find directions on how to get through this first step by viewing our Quick Start Guide.
The goal of this tutorial is to help guide you through the process of adding new elements to your charts. By now you should have created a simple chart as described in our Quick Start guide.
Basic Chart
Below is a very basic bar chart.

{
	"type":"bar",
	"series":[
		{
		"values":[48,44,14,32]
		},
		{
		"values":[22,36,15,37]
		}
	]
}
Title
The first thing we are going to do to our chart is add a title. This will allow you to provide your users with an idea of what your chart represents.
The first step in adding any element to your chart is determining what object you are looking to manipulate. In this case, we are looking to manipulate the title so we are going to add the “title”:{ }, object to the chart.
We are going add the "text":" " attribute along with the text we would like to show as the title.
{
	"type":"bar",
	"title":{
		"text":"Chart Title"
	},
	"series":[
		{
		"values":[48,44,14,32]
		},
		{
		"values":[22,36,15,37]
		}
	]
}

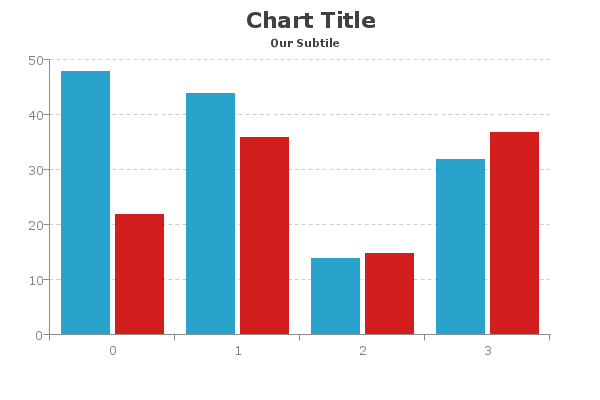
Sub-Title
As you can see we added a title to the top of the chart. Now we can also add the "subtitle":{ }, object if we want to provide more information about what is being charted. Again, you will add the "text":" " attribute and the text you want to have appear as the subtitle.
{
	"type":"bar",
	"title":{
		"text":"Chart Title"
	},
	"subtitle":{
		"text":"Our Subtile"
	},
	"series":[
		{
		"values":[48,44,14,32]
		},
		{
		"values":[22,36,15,37]
		}
	]
}
Legend
As you can see adding elements to your chart is pretty simple. Let's add one more element to help our users understand what kind of data we are charting. We are going to add a legend. To do this you simply add the "legend":{ }, object to your code.
{
	"type":"bar",
	"title":{
		"text":"Chart Title"
	},
	"subtitle":{
		"text":"Our Subtile"
	},
	"legend":{

	},
	"series":[
		{
		"values":[48,44,14,32]
		},
		{
		"values":[22,36,15,37]
		}
	]
}
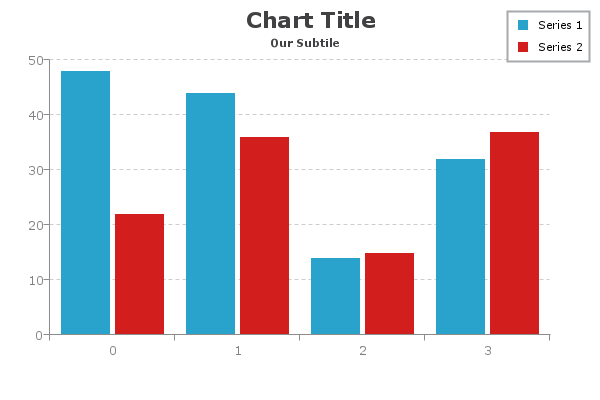
As you can see just by adding the "legend":{ }, object you trigger ZingChart to include this element on the chart. We can come back to this later and discuss ways to style the legend to improve things like the look, position, and layout.
Scale-X
Now let's move on to making sure the data on our chart is represented by the correct axis values. We need to add the correct values to the x-axis. This will allow your users to understand exactly what each bar represents.
Since we are looking to manipulate the x-axis we are going to add the “scale-x”:{ }, object to the chart.
{
	"type":"bar",
	"title":{
		"text":"Chart Title"
	},
	"subtitle":{
		"text":"Our Subtile"
	},
	"legend":{

	},
	"scale-x":{

	},
	"series":[
		{
		"values":[48,44,14,32]
		},
		{
		"values":[22,36,15,37]
		}
	]
}
Now we are going to add the "values":[ ], attribute and include the values we want to be represented on the x axis.
{
	"type":"bar",
	"title":{
		"text":"Chart Title"
	},
	"subtitle":{
		"text":"Our Subtile"
	},
	"legend":{

	},
	"scale-x":{
		"values":["Quarter 1","Quarter 2","Quarter 3","Quarter 4"]
	},
	"series":[
		{
		"values":[48,44,14,32]
		},
		{
		"values":[22,36,15,37]
		}
	]
}

Y-Axis
As you can see we added in 4 text values to the x-axis to represent our 4 data plots. When you are adding text values you need to be sure to place each value inside of “ “ and then separate the values with a comma.
If you were only adding numbers as the x-axis values you do not need the “ “ and can add just the numbers separated by a , “values”:[2, 4, 6, 8].
Scale-Y
Now let's change the scale on the y-axis. This we are going to do a little bit differently. Just like we did before we are going to want to add an object to manipulate the y axis.
To do this we will add the “scale-y”:{ }, object into our code. We are also going to include the "values":" " attribute with the scale we want to be represented on the y axis.
{
	"type":"bar",
	"title":{
		"text":"Chart Title"
	},
	"subtitle":{
		"text":"Our Subtile"
	},
	"legend":{

	},
	"scale-x":{
		"values":["Quarter 1","Quarter 2","Quarter 3","Quarter 4"]
	},
	"scale-y":{
		"values":"0:100:20"
	},
	"series":[
		{
		"values":[48,44,14,32]
		},
		{
		"values":[22,36,15,37]
		}
	]
}
What we have added here is the scale for the y-axis values. The first number represents what value you want the y-axis to start with, in this case we used 0. The middle number represents what value you want the y-axis to end with. Finally, the third number is the increments in which you want the scale to increase.
As you can see we changed the increments to 20. If you look at the first chart the scale goes from 0 to 50 and increases by a value of 10. After we made our changes the scale still starts at 0 but goes up to 100 and increases by increments of 20.


You may have noticed that we used a slightly different syntax when we manipulated the x-axis values and the y-axis values. This can be done in one of two ways:
The first option is to use the "values": attribute and list the values within [ ] and separate them with " ", if using text or simply just , if using numbers. This is a definitive way on specifying what values you want to associate to a particular axis.
The second option is to use the "values": attribute and list the values within
" " and separate them with : doing this allows you to enter a scale with a beginning, an end, and an increment.
By now you should have a pretty good understanding of how to add basic objects and attributes to your chart. This is important because a majority of ZingChart is controlled with objects and attributes. You will see more of this in our next tutorial about Chart Styling. Until next time.